REVIEW OF THE ECONOMY 2013
16
SUSTAINING GROWTH, SECURING PROSPERITY
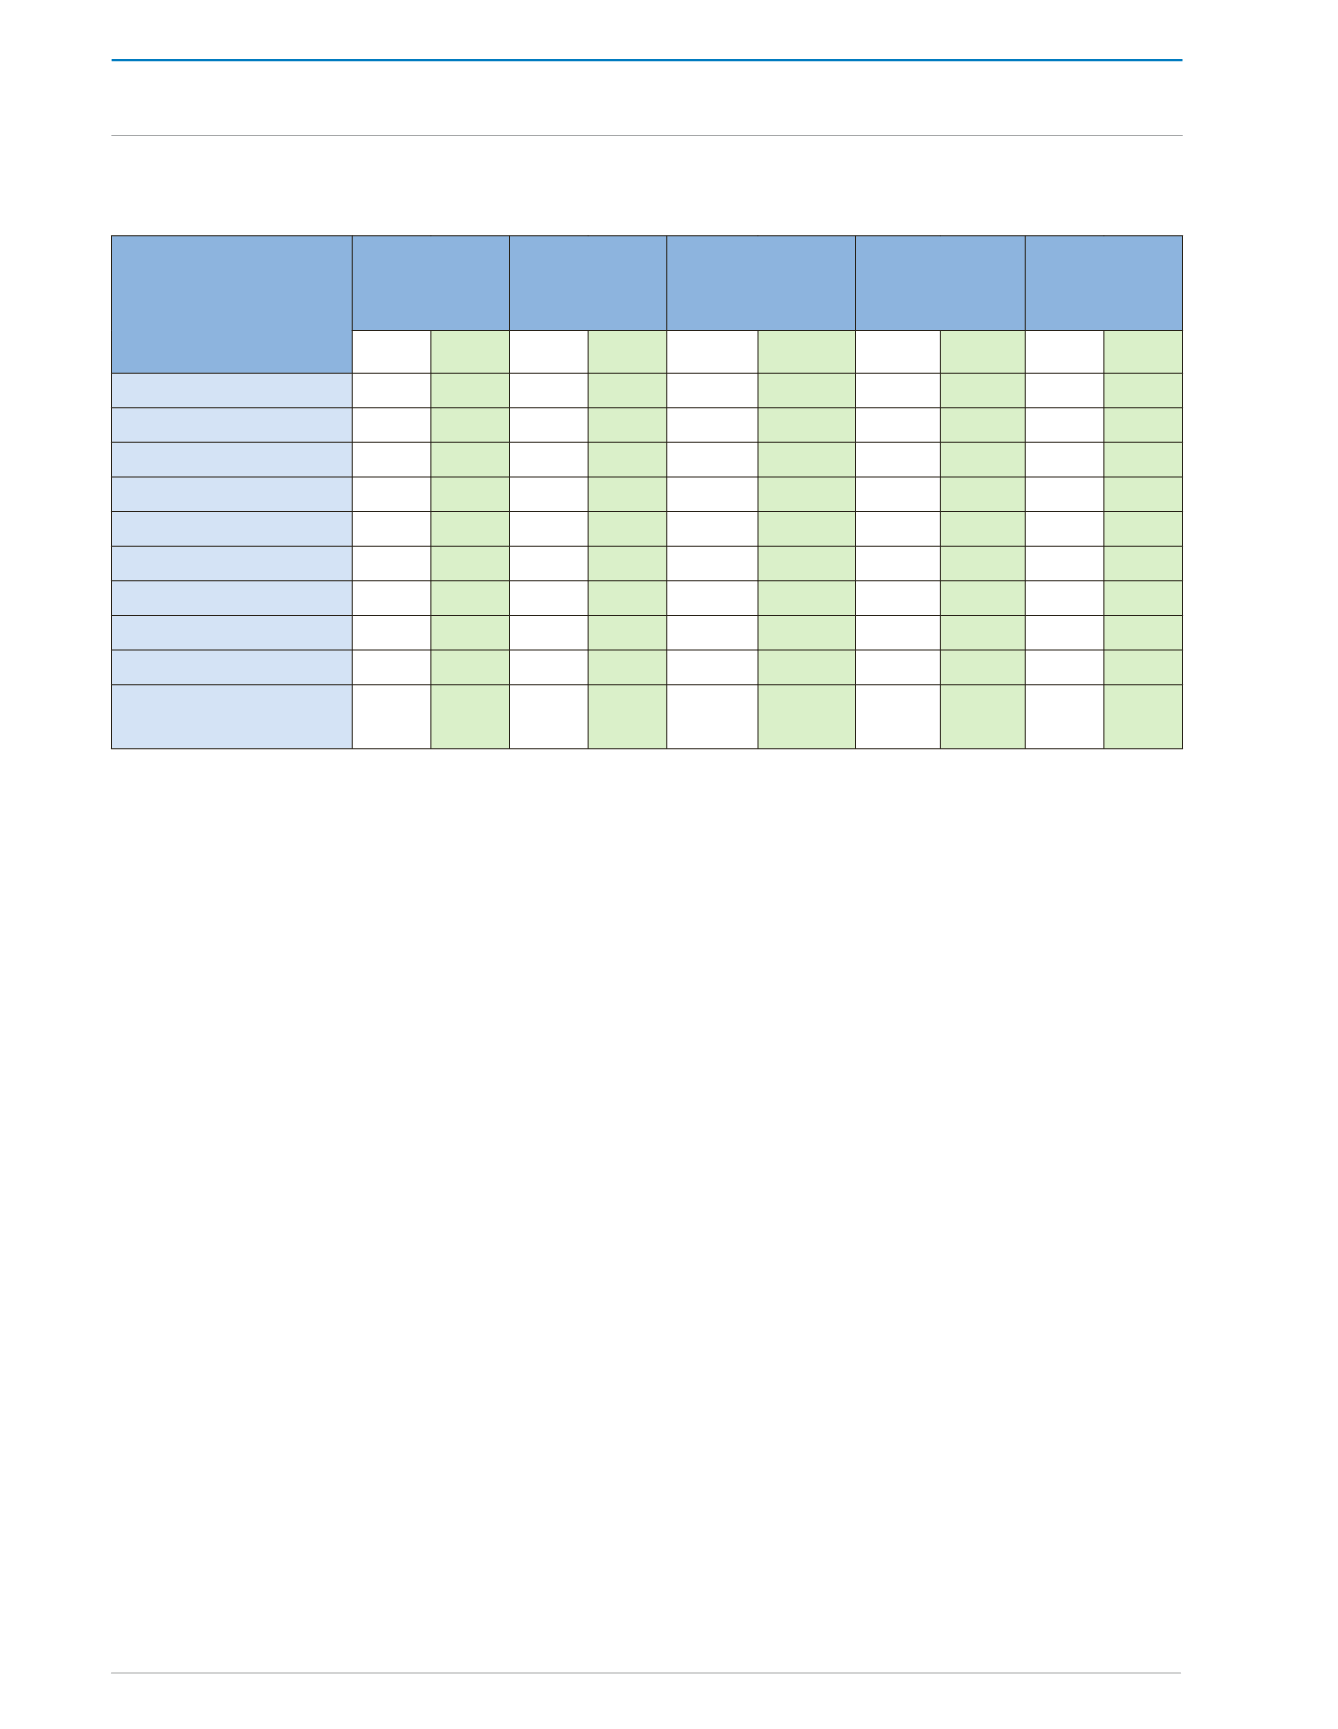
Table 2:
Macroeconomic Indicators for Selected CARICOM Economies
Real GDP
Growth
Consumer
Prices
Unemployment
(%)
Current
Account
Balance
1
Fiscal
Balance
1
2011 2012 2011 2012 2011 2012 2011 2012 2011 2012
Barbados
0.6 0.0 9.5 1.2 11.2
2
11.6 -8.7 -5.7 1.1 -0.5
Guyana
5.4 3.3 3.3 4.6 n/a
n/a -13.4 -13.2 -1.5 -3.4
Jamaica
1.5 0.1
6.0 7.4 12.7
3
13.0 -12.6 -11.9 3.2 5.2
ECCU (All Countries):
-0.5 0.0 4.1
3.0 n/a
n/a -18.0 -17.8 -2.6 -1.6
Antigua and Barbuda -3.0 1.6 4.0 1.8 n/a
n/a -10.8 -12.8 -3.5 1.1
Dominica
1.9 0.4 2.0 3.6 n/a
9.8 -12.8 -13.5 -9.4 -8.8
Grenada
1.0 -0.8 3.5 1.8 n/a
n/a -23.3 -23.0 -3.6 -3.2
St. Kitts and Nevis
-1.9 -0.9 2.9 0.3 n/a
n/a -15.6 -13.5 5.3 7.6
St. Lucia
1.4 -0.4 4.8 6.2 n/a 20.6 -20.1 -19.1 -2.9 -4.0
St. Vincent and the
Grenadines
0.4 0.5 4.7 0.8 n/a
n/a -28.8 -27.9 -2.1
-1.1
Source: For Barbados: Regional Economic Outlook (R.E.O.): Western Hemisphere - Main Economic Indicators, May 2013 (IMF)
For Guyana – R.E.O.: Western Hemisphere- Main Economic Indicators, May 2013
For Jamaica – R.E.O.: Western Hemisphere- Main Economic Indicators, May 2013
For ECCU Countries - R.E.O.: Western Hemisphere- Main Economic Indicators, May 2013
n/a not available
1
Primary balance of the R.E.O., May 2013, Western Hemisphere and Ministry of Finance and the Economy’s estimates derived from the
Eastern Caribbean Central Bank (Percent of GDP)
2
Central Bank of Barbados Press Release June 2013
3
Bank of Jamaica 2012 Annual Report
ECONOMIC PERFORMANCE OF CARICOM STATES


