REVIEW OF THE ECONOMY 2013
23
SUSTAINING GROWTH, SECURING PROSPERITY
to US$95.31 in February 2013. Thereafter, the
price softened to US$92.02 per barrel in April,
before surging to US$104.67 per barrel in July.
Accordingly, the WTI price of a barrel of crude
averaged US$93.39 over the first ten months
of fiscal 2012/2013, a 2.6 percent contraction
from its average of US$95.89 per barrel in the
corresponding 2011/2012 period
(Table 3)
.
The average monthly price of a barrel of
European Brent crude oil also fluctuated
within a narrow band during the first quarter
of fiscal 2012/2013, between US$111.71 in
October 2012 and US$109.49 in December
2012, and thereafter peaked at US$116.05 in
February 2013. The price subsequently fell to
US$102.25 per barrel in April and held steady
for two months before recovering to US$107.93
per barrel in July. During October 2012 to July
2013, the monthly price of a barrel of European
Brent crude oil averaged US$108.34, which was
2.5 percent less that its average of US$111.15,
one year earlier. The monthly average price
differential between WTI and Brent decreased
notably during the review period fromUS$22.22
in October 2012 to US$3.26 in July 2013. The
average price differential for the entire October
to July period was $14.95, which is slightly lower
than the $15.27 differential recorded one year
earlier.
NATURAL GAS
Notwithstanding significant upgrade and
maintenance works by the country’s two largest
natural gas producers, (BPTT and BGTT) in
September and October 2012, natural gas
production rose to 28,733 million cubic metres
during the first eightmonths of fiscal 2012/2013.
This marked a 2.9 percent increase from the
27,923 million cubic metres recorded one year
earlier when the impact of the maintenance
works undertaken by these companies were
more severely felt
(Appendix 8 and Figure 2)
.
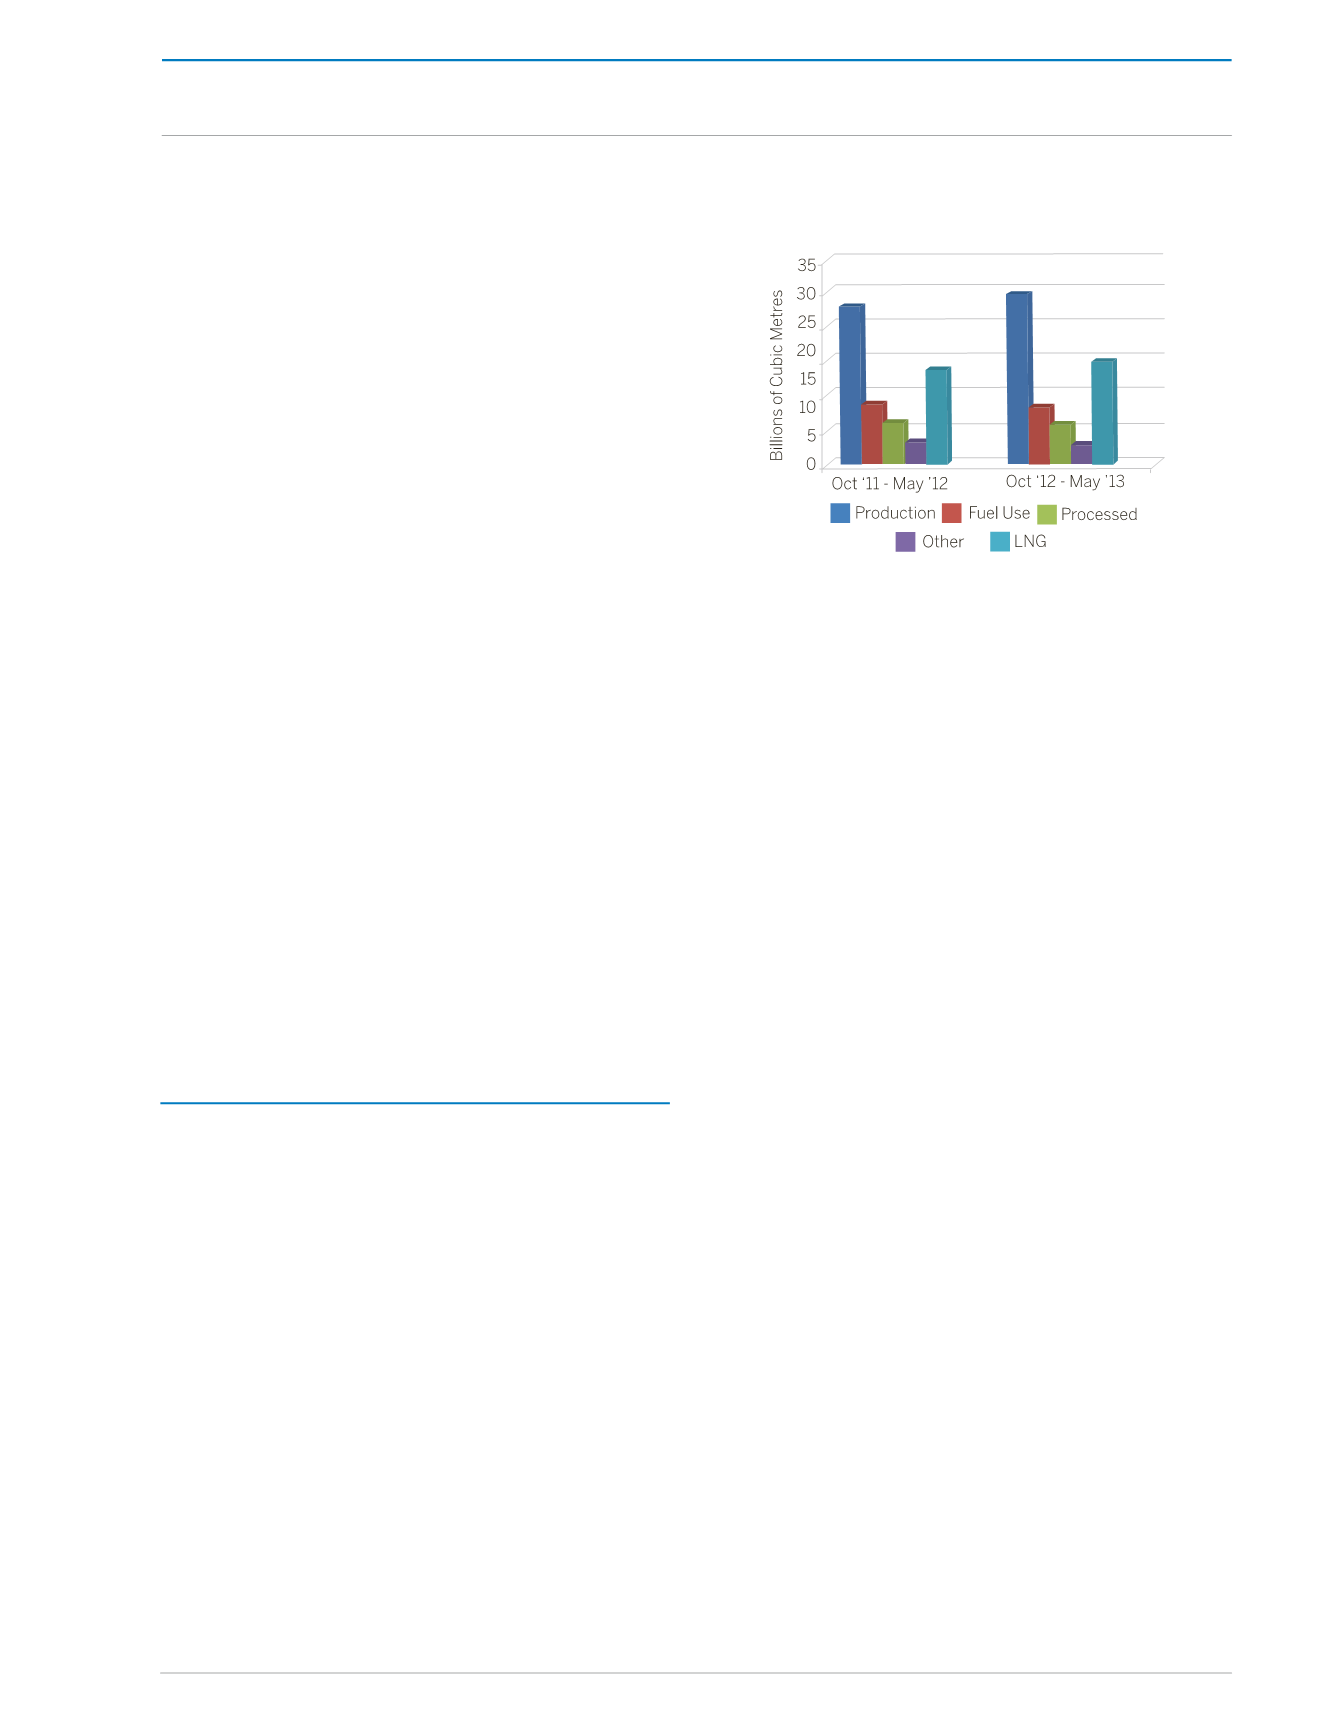
Figure 2:
Natural Gas Production and
Utilisation
Source: Ministry of Energy and Energy Affairs
Approximately 48.0 percent or 13,782 million
cubic metres of the total natural gas produced
during the October 2012 to May 2013 period,
was utilised for the production of liquefied
natural gas (LNG). This represented a 7.9
percent increase from the 12,778 million cubic
metres utilised one year earlier. Other major
uses of natural gas during the period were as
a fuel source for industrial plants (7,464 million
cubicmetres) andas processedgas or feedstock
for petrochemical plants (5,103 million cubic
metres). These reflect declines of 2.6 percent
and 3.7 percent respectively, when compared
to the corresponding 2011/2012 period. The
amount of natural gas re-injected into reservoirs
contracted by 0.6 percent to 1,288 million cubic
metres in the current period, whilst natural gas
vented into the atmosphere, and that utilised as
Natural Gas Liquids, increased by 28.4 percent
(to 913 million cubic metres), and 5.9 percent
(to 184 million cubic metres), respectively.
The monthly average Henry Hub price of natural
gas remained relatively stable during the first
five months of fiscal 2012/2013, marginally
increasing from US$3.32 per thousand cubic
feet in October 2012 to US$3.54 per thousand
cubic feet in November, before moderating to
US$3.33 per thousand cubic feet in February
2013. Thereafter, the monthly average price
rose to a high of US$4.17 per thousand cubic
THE REAL ECONOMY


