REVIEW OF THE ECONOMY 2013
22
SUSTAINING GROWTH, SECURING PROSPERITY
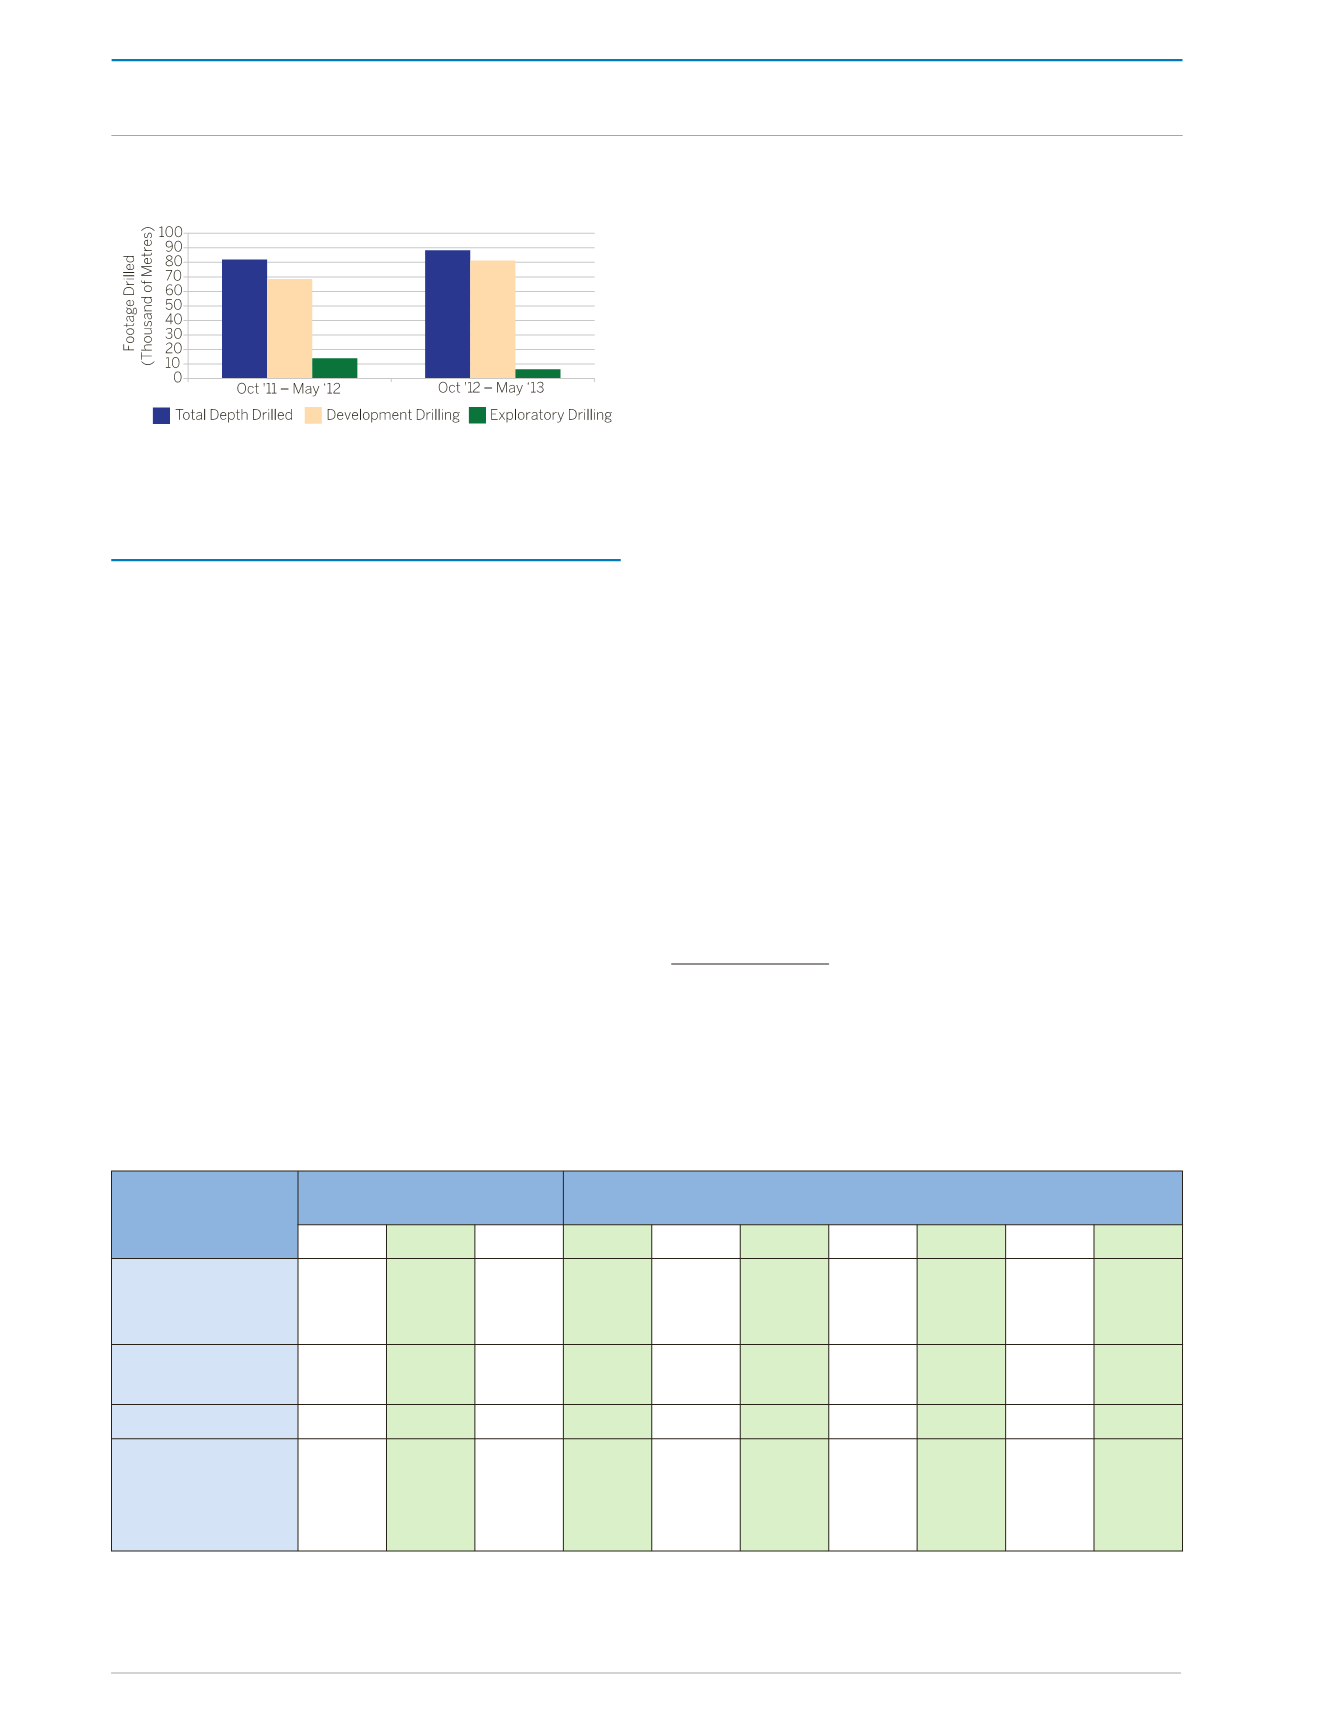
Figure 1:
Development and Exploratory Drilling
Source: Ministry of Energy and Energy Affairs
CRUDE OIL AND CONDENSATE
Production of crude and condensate totalled
19.7 million barrels during the period October
2012 to May 2013, representing a 4.3 percent
decline from the 20.6million barrels produced in
the corresponding period one year earlier. This
outcome was precipitated by a 25.6 percent
decline in condensate production (from 3.9
million barrels to 2.9 million barrels), which
outstripped a 0.6 percent expansion in crude
production (from 16.7 million barrels to 16.8
million barrels)
(Appendix 7)
. The extraction of
drier natural gas from new and existing natural
gas reservoirs, accounted in most part for the
lower condensate yield during the period.
Offshore crude and condensate production
declined by 11.3 percent to 14.0 million barrels
during the eight-month review period, whilst
onshore production increased by 18.9 percent
to 5.7 million barrels. As a consequence, the
share of total crude and condensate which is
produced onshore rose to 28.7 percent from
23.1 percent, and the share produced offshore
fell to 71.3 percent from 76.9 percent.
During the period October 2012 to July 2013,
Trinidad and Tobago’s oil and gas export
products generally benefitted from strong
export prices on account of the continued, albeit
subdued recovery in global economic growth,
and the on-going geopolitical tensions in the
Middle East. However, though higher than one
year ago, the Henry Hub price for natural gas
remained relatively soft, when compared to gas
prices in other export markets, owing to the on-
going impact of shale gas
4
.
The average monthly price per barrel of West
Texas Intermediate (WTI) crude oil fluctuated
between US$89.49 in October 2012 and
US$87.86 in December 2012, before ascending
4
Shale gas refers to natural gas that is trapped within shale
formations (fine-grained sedimentary rocks that can be rich
sources of petroleum and natural gas). The use of hori-
zontal drilling and hydraulic fracturing in recent years has
facilitated access to large volumes of shale gas that were
previously uneconomical to produce.
2012
2013
Oct
Nov Dec Jan Feb Mar
Apr
May Jun Jul
Crude Oil
(Spot Price US$/
Barrel)
West Texas
Intermediate
89.49 86.53 87.86 94.76 95.31 92.94 92.02 94.51 95.77 104.67
European Brent
111.71 109.06 109.49 112.96 116.05 108.47 102.25 102.56 102.92 107.93
Natural Gas
(US$/Thousand
Cubic Feet)
Henry Hub
3.32 3.54 3.34 3.33 3.33 3.81
4.17 4.04 3.83 3.62
Source: Energy Information Administration (US)
Table 3:
Oil and Gas Prices
THE REAL ECONOMY


