REVIEW OF THE ECONOMY 2013
32
SUSTAINING GROWTH, SECURING PROSPERITY
from 0.6 percent to 2.1 percent); Recreation
and Culture (from 0.6 percent to 2.6 percent);
and Food and Non-Alcoholic Beverages (from
14.0 percent to 28.3 percent) were the main
contributors to the spike in inflation during
the period January to May. The deceleration in
inflation in the June to December period was
primarily on account of lower rates of inflation
for Housing (falling from 2.6 percent in May, to
1.5 percent in December) and Food and Non-
Alcoholic Beverages (from 28.3 percent in May,
to 12.7 percent in December).
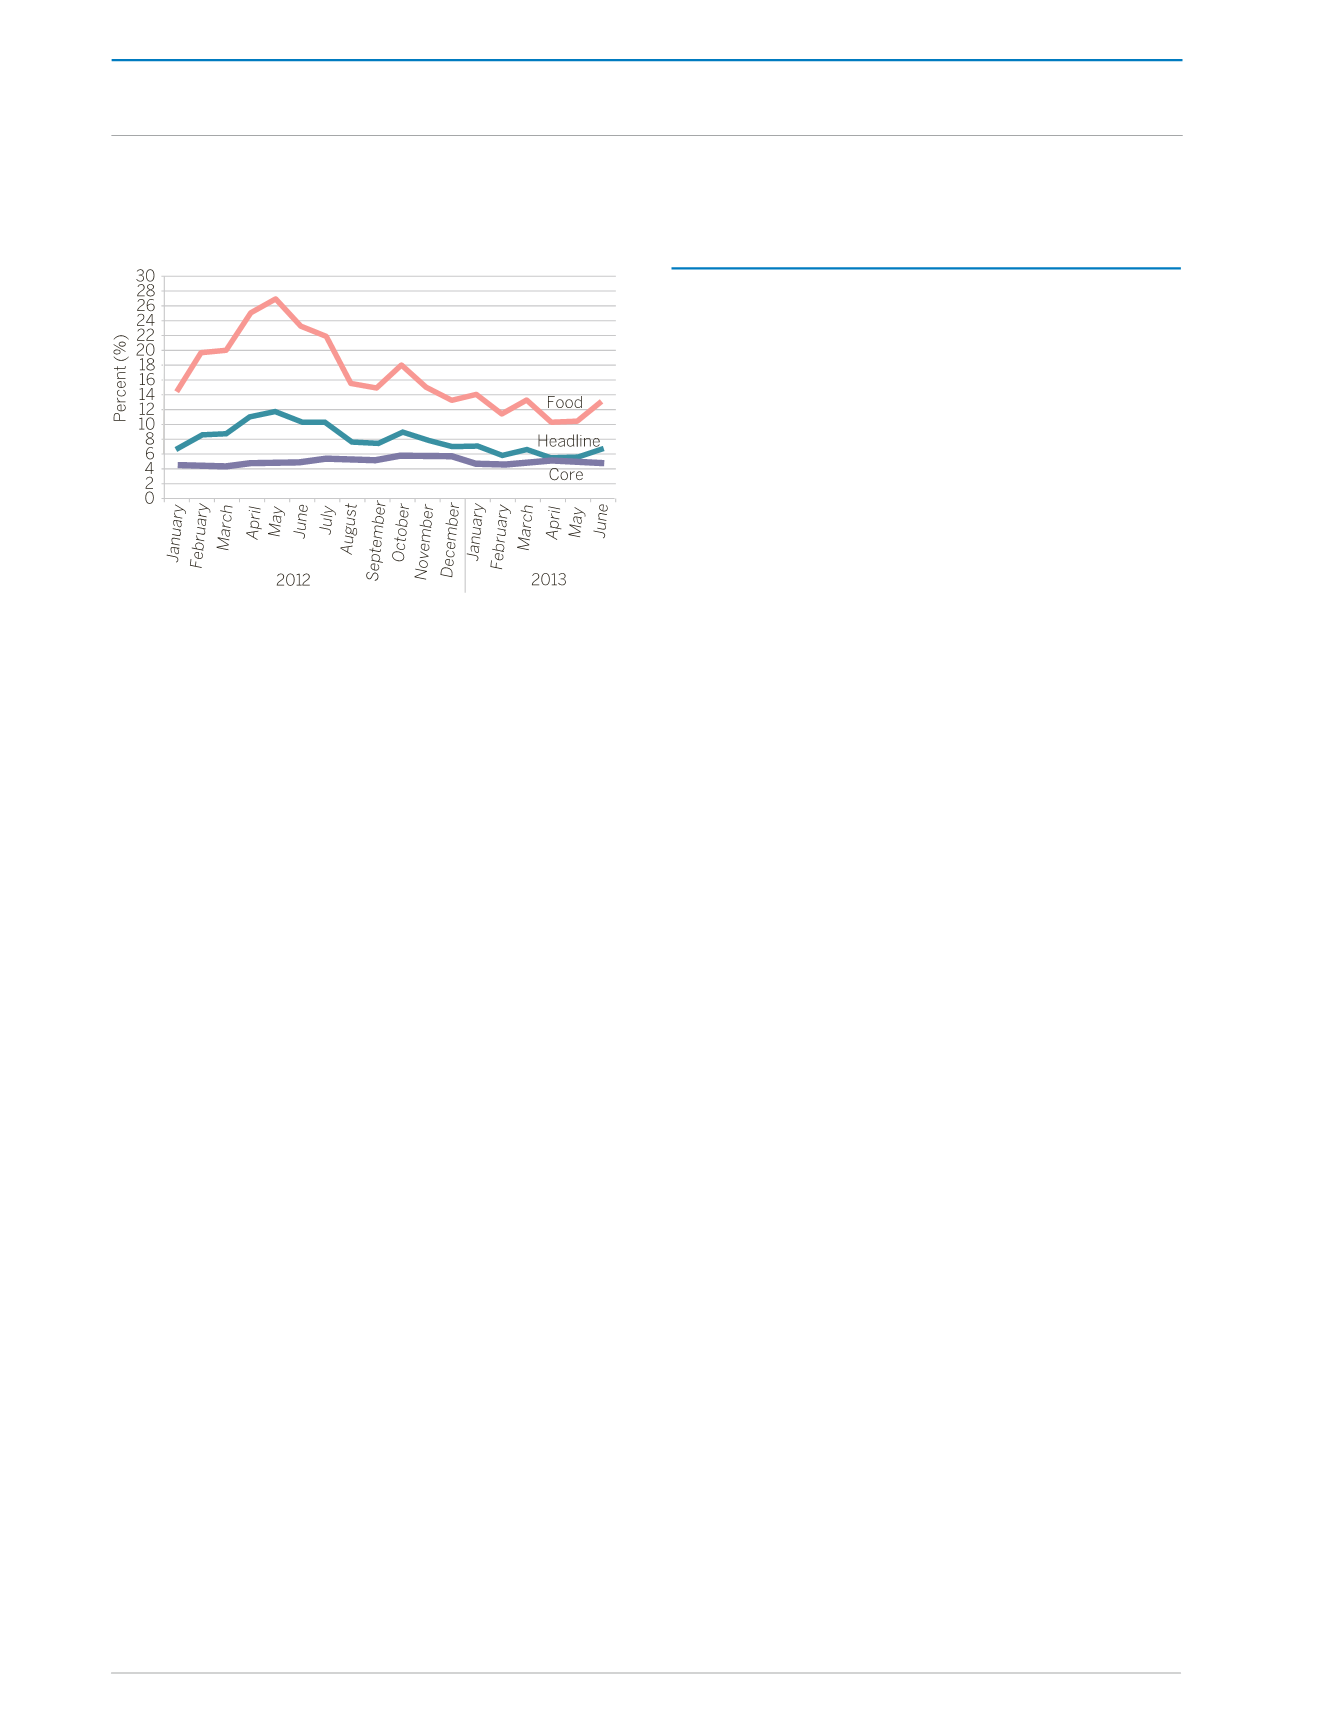
Thevolatilityof Food inflationexperiencedduring
the 2012 period, was primarily on account of
large variations in the monthly price movements
for Fruit (from 41.4 percent in May, to -2.8
percent in December); Vegetables (from 7.5
percent in January, to 45.2 percent in May, and
thereafter easing to 26.8 percent in December);
and Breads and Cereals (decelerating from 4.5
percent in June, to 0.7 percent in December).
The annual average rate of core inflation
accelerated from 1.7 percent in 2011 to 2.5
percent in 2012 as a result of the uptick in prices
for Housing and Transport. However, during the
twelve-month period of 2012, price increases for
Recreation and Culture, Transport, and Health
were the main contributors to core inflation
trending upwards from 1.8 percent in January
(year-on-year) to 3.1 percent in December.
PRODUCTIVITY
The productivity of all workers in all industries,
as measured by the All Items Productivity Index,
fell by 6.3 percent during fiscal 2012, in contrast
to the 7.4 percent increase recorded in fiscal
2011.
In year-on-year terms, the productivity of all
workers in all industries decreased by 4.9
percent in the fourth quarter of fiscal 2012,
compared to the 3.3 percent (year-on-year)
increase in productivity reported in the fourth
quarter of fiscal 2011. Declining productivity
in: Water (-28.4 percent); Electricity (-22.1
percent); Exploration and Production of Oil and
Natural Gas (-17.8 percent); Petrochemicals
(-13.8 percent); Oil and Natural Gas Refining
(-9.8 percent); Food Processing (-5.5 percent);
Textiles, Garments and Footwear (-3.2 percent);
Printing, Publishing and Paper Converters (-2.5
percent); and Wood and Related Products
(-1.7 percent) all contributed to the overall
weakening in productivity during fiscal 2012.
Notwithstanding, gains in productivity were
experienced in: Chemicals (17.4 percent);
Miscellaneous Manufacturing (15.2 percent);
Assembly Type and Related Products (13.8
percent); and Drink and Tobacco (2.6 percent).
Overall, productivity in the non-energy sector
fell by 2.3 percent (year-on-year) in the fourth
quarter, compared to an 8.8 percent productivity
gain reported for the similar period one year
earlier.
The productivity of all workers in all industries
roseby2.5percentduringthefirstquarteroffiscal
2013, a marked improvement when compared
to the 8.7 percent decline which was recorded
in the first quarter of fiscal 2012. Productivity
increases were registered in most industries
including: Assembly Type and Related Products
(40.4 percent); Food Processing (33.9 percent);
Figure 7:
Prices – Percentage Change (Year-on-
Year)
Source: Central Statistical Office
THE REAL ECONOMY


