REVIEW OF THE ECONOMY 2013
24
SUSTAINING GROWTH, SECURING PROSPERITY
feet in April, before softening to US$3.62 per
thousand cubic feet in July. The Henry Hub price
averaged US$3.63 per thousand cubic feet for
the October 2012 to July 2013 review period,
which represented a 34.0 percent increase from
the average price of US$2.71 per thousand cubic
feet obtained during the comparative 2011/2012
period.
The Ryder Scott audit of non-associated gas
reserves for theyearendingDecember31st2012,
estimated that Trinidad and Tobago’s total gas
reserves andexploratory resources amounted to
56,851 billion cubic feet. Of this total, proven gas
reserves accounted for 13,106 billion cubic feet
(or 23.1 percent); probable reserves 6,142 billion
cubic feet (or 10.8 percent); possible reserves
5,987 billion cubic feet (or 10.5 percent); and
unrisked exploratory resources 31,616 billion
cubic feet (or 55.6 percent). During calendar
2012, Trinidad and Tobago is estimated to have
produced 1,509 billion cubic feet of natural gas.
The country’s proved and probable reserves
would supply natural gas for approximately 12.8
years, at this rate of production.
LNG EXPORTS
During the first sevenmonths of fiscal 2012/2013,
Trinidad and Tobago exported 435.2 trillion
British Thermal Units (BTU) of Liquefied Natural
Gas (LNG) to fourteen (14) countries, marking a
6.9 percent increase from the 407.2 trillion BTU
exported one year earlier
(Appendix 8)
.
The growing abundance of domestic gas
supplies in the US and consequent unattractive
Henry Hub prices over the past few years, have
given momentum to Trinidad and Tobago’s use
of the international spot market to earn higher
natural gas prices in Latin America, Europe
and Asia. In this regard, for the first time since
Trinidad and Tobago began exporting LNG,
the United States has been replaced as this
country’s leading LNG export destination, falling
to fourth place.
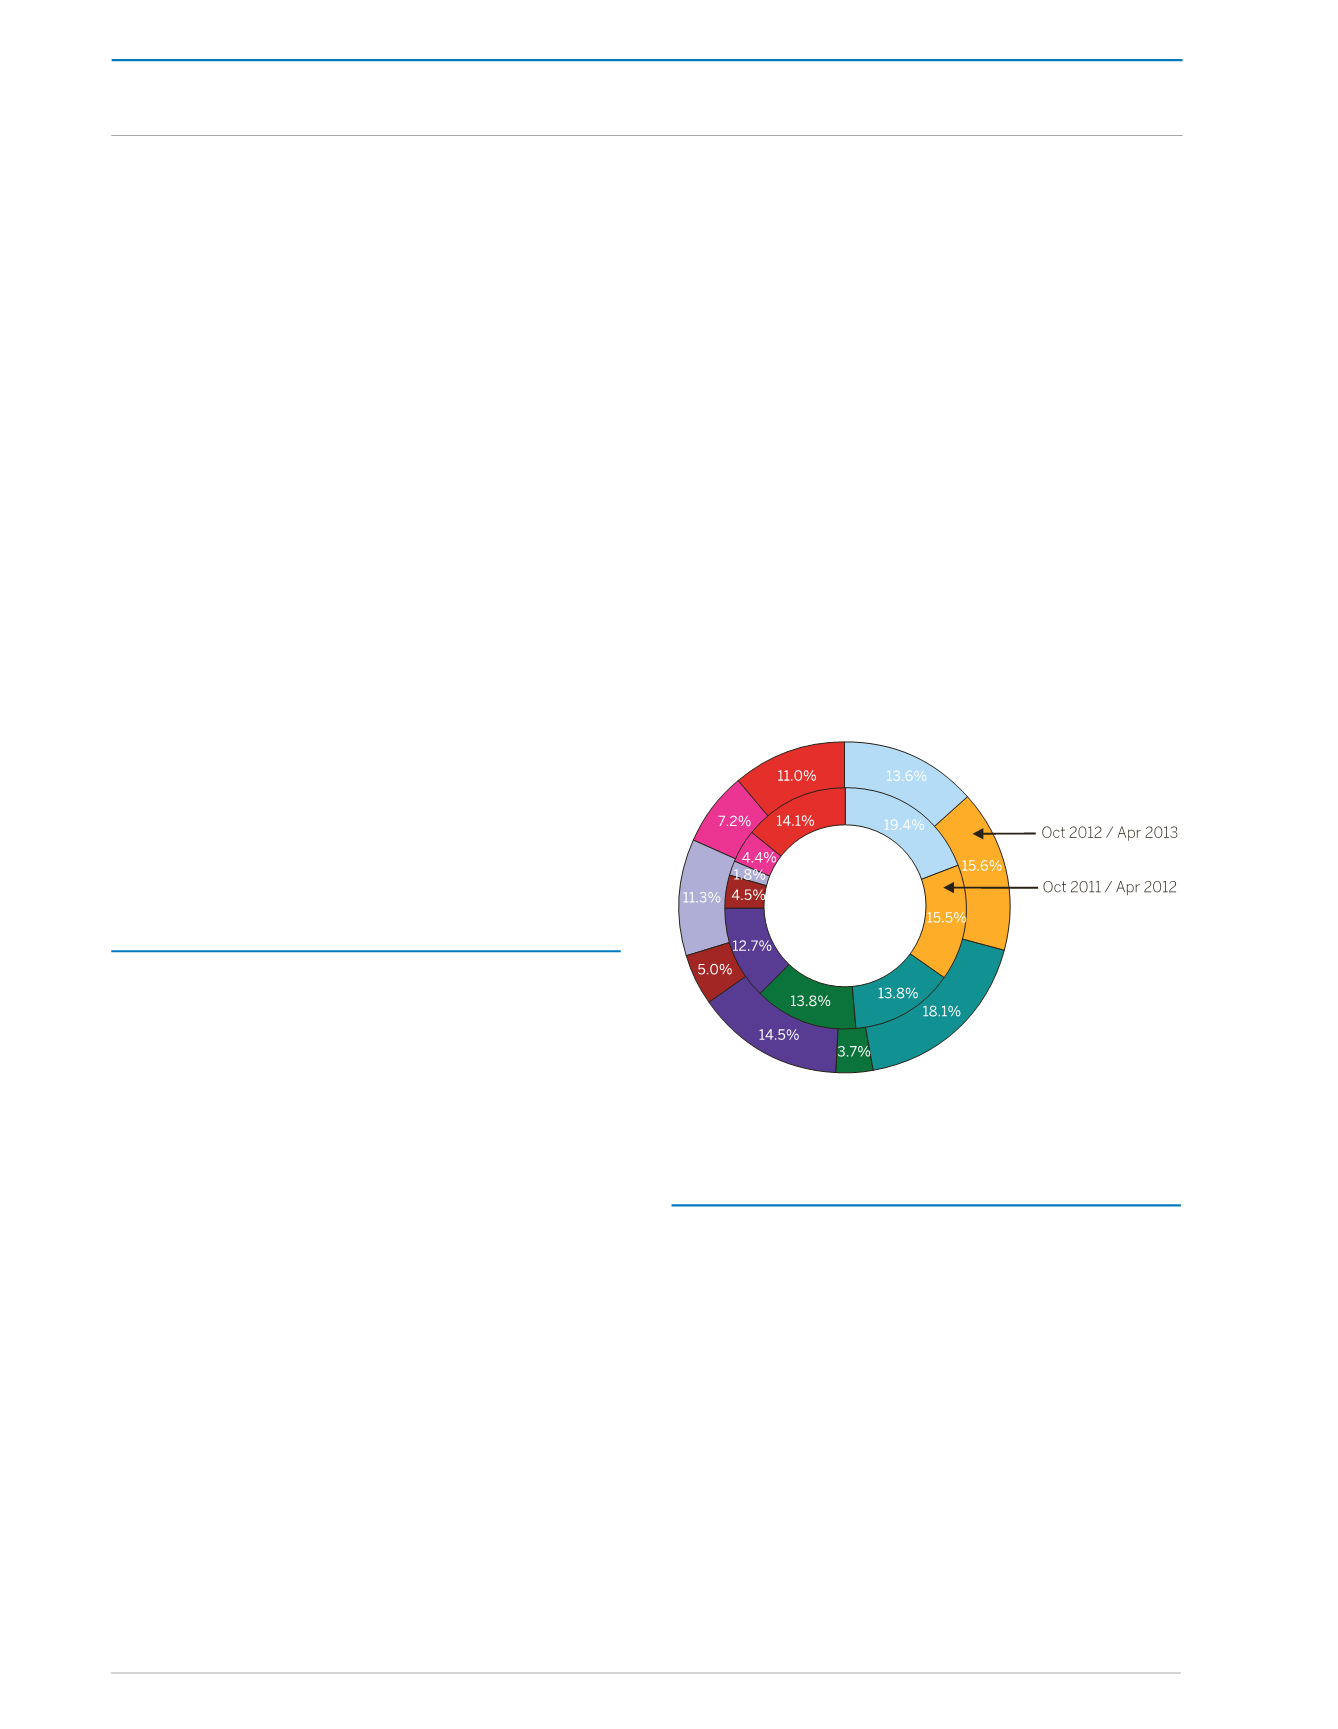
Trinidad and Tobago’s leading LNG export
destinations during the October 2012 to April
2013 review period were Chile, Argentina, and
Spain. These accounted for 18.1 percent, 15.6
percent, and 14.5 percent respectively, of total
LNG exports. This marked an improvement
from their respective shares of 13.8 percent, 15.5
percent and 12.7 percent in the corresponding
2011/2012 period. Over the same period, the
share of LNG exports to the United States fell
to 13.6 percent from 19.4 percent. Other LNG
export destinations during the review period
included Brazil (11.3 percent); Puerto Rico (7.2
percent); and the Dominican Republic (5.0
percent)
(Figure 3)
.
Figure 3:
Exports of LNG by Destination
Source: Ministry of Energy and Energy Affairs
PETROCHEMICALS (AMMONIA,
UREA AND METHANOL)
During the period October 2012 to May 2013,
production and export levels of ammonia and
methanol declined in comparison with the
similar period one year earlier. These declines
outweighed increases in the levels of production
and exports of urea.
THE REAL ECONOMY


