REVIEW OF THE ECONOMY 2013
12
SUSTAINING GROWTH, SECURING PROSPERITY
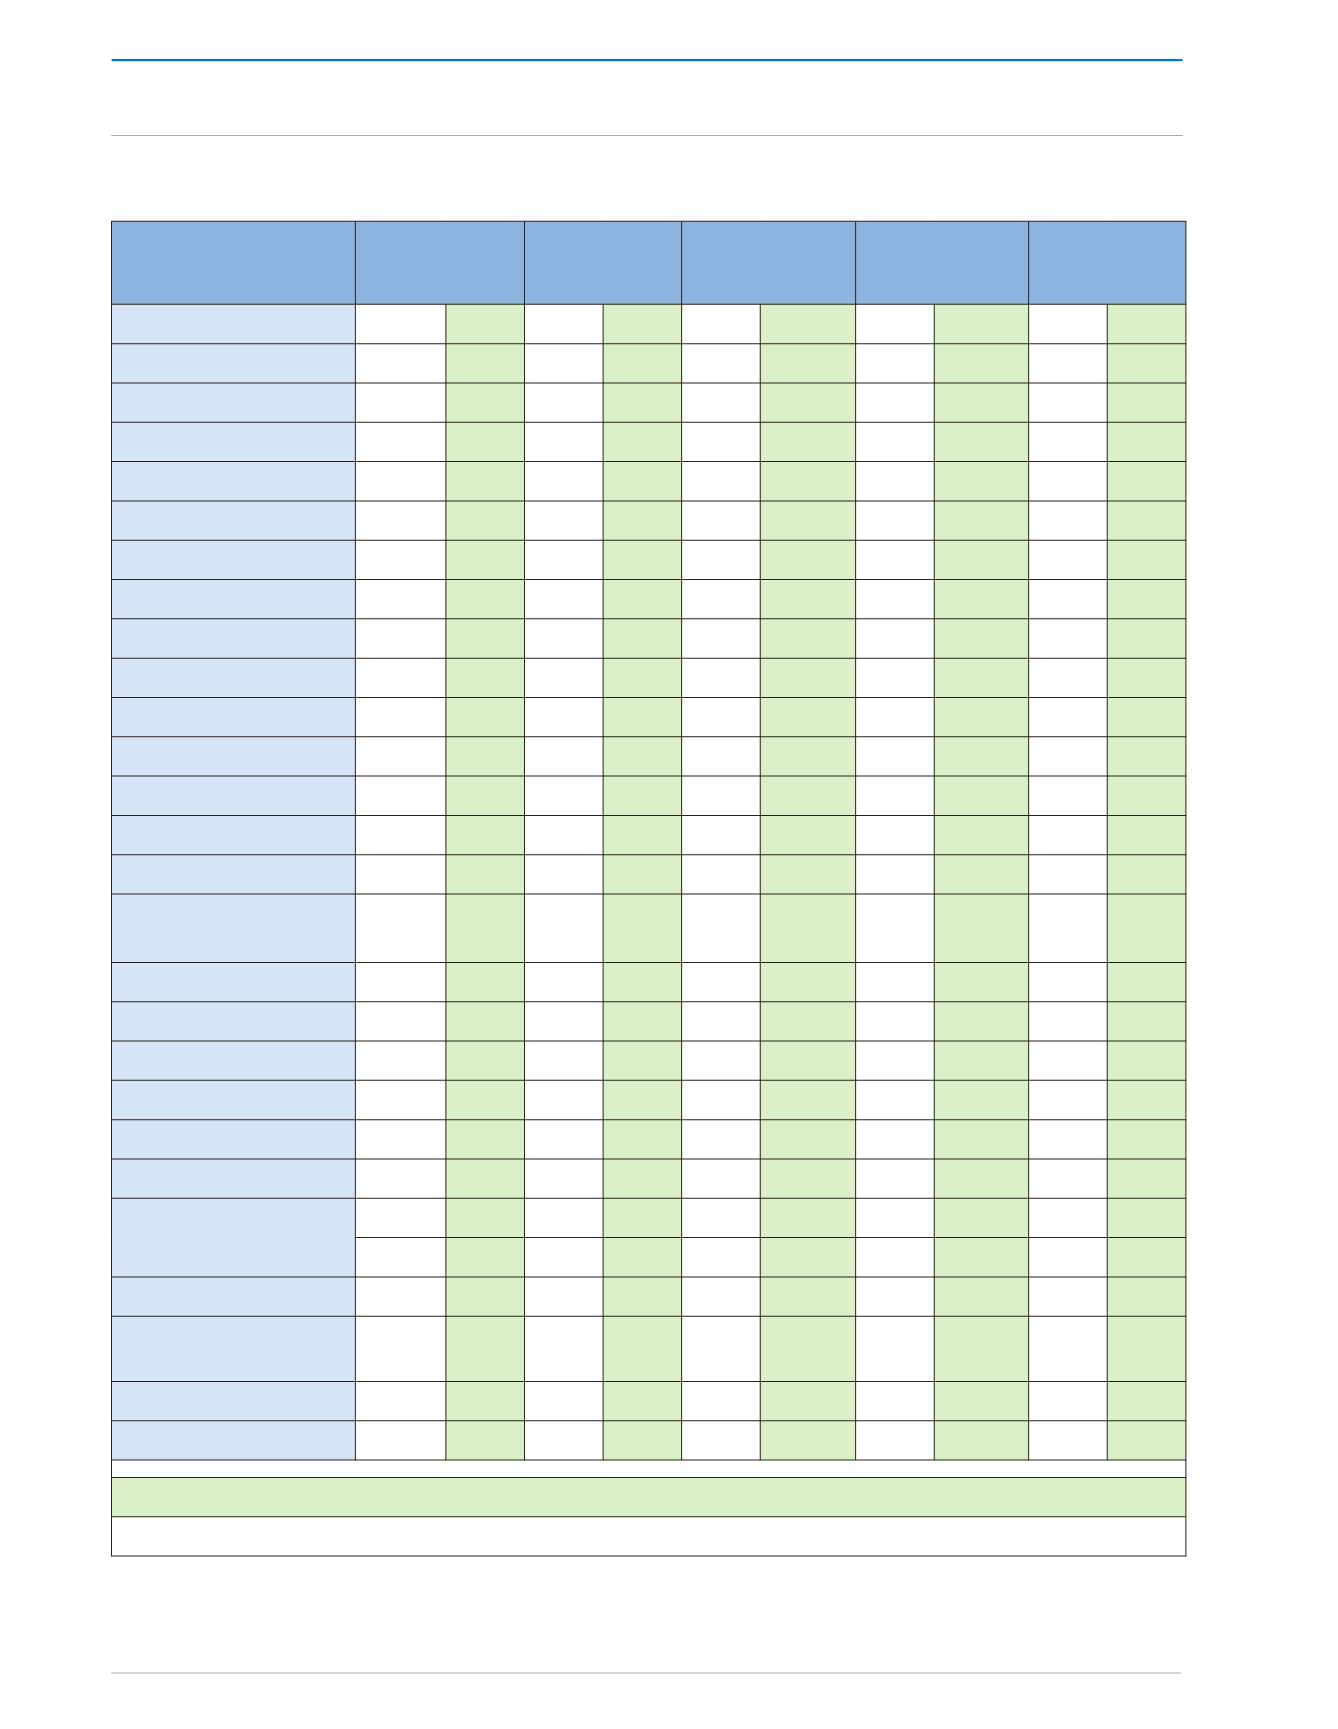
Table 1:
Macroeconomic Indicators for Selected Economies
Real
GDP Growth
Consumer
Prices
Unemployment
(%)
Current Account
Balance
1
Fiscal
Balance
1
2012 2013 2012 2013 2012 2013 2012 2013 2012 2013
Advanced Economies
1.2 1.2 2.0 1.7 8.0 8.2 -0.1
-0.1
-5.9 -4.7
United States
2.2
1.9 2.1
1.8 8.1
7.7
-3.0 -2.9 -8.5 -6.5
Japan
2.0 1.6 0.0 0.1
4.4
4.1
1.0 1.2 -10.2 -9.8
Euro Zone
-0.6 -0.3 2.5 1.7 11.4 12.3 1.2 2.3 -3.6 -2.9
United Kingdom
0.2 0.7 2.8 2.7 8.0 7.8 -3.5 -4.4 -8.3 -7.0
Germany
0.9 0.6 2.1
1.6 5.5
5.7
7.0 6.1
2.0 -0.3
Spain
-1.4 -1.6 2.4 1.9 25.0 27.0 -1.1
1.1
-10.3 -6.6
Greece
-6.4 -4.2 1.0 -0.8 24.2 27.0 -2.9 -0.3 -6.4 -4.6
Portugal
-3.2 -2.3 2.8 0.7 15.7 18.2 -1.5
0.1
-4.9 -5.5
Ireland
0.9
1.1
1.9 1.3 14.7 14.2 4.9
3.4
-7.7 -7.5
Advanced Asia
2.1
2.2 3.6 2.9 3.6 3.5 6.5 5.9 n/a n/a
Hong Kong
1.4
3.0 4.1
3.5 3.3
3.2
2.3
2.0 0.2 1.7
Korea
2.0 2.8 2.2 2.4 3.3
3.3
3.7
2.7
1.9 2.4
Singapore
1.3
2.0 4.6 4.0 2.0 2.0 18.6 16.9 5.6 5.0
Emerging and
Developing Asia
6.6 7.1
4.5 5.0 n/a n/a
1.1
1.1
-3.2 -3.2
China
7.8 8.0 2.6 3.0 4.1
4.1
2.6 2.6 -2.2 -2.1
India
4.0 5.7 9.3 10.8 n/a
n/a
-5.1
-4.9 -8.3 -8.3
Latin America
3.0 3.4 6.0 6.1
n/a n/a -1.7
-1.7
-2.7 -1.7
Argentina
1.9 2.8 10.0 9.8 7.2
7.1
0.1
-0.1
n/a n/a
Brazil
0.9 3.0 5.4 6.1
5.5
6.0 -2.3 -2.4 -2.8 -1.2
Mexico
3.9 3.4 4.1
3.7 4.8
4.8 -0.8 -1.0 -3.7 -3.1
Commonwealth of
Independent States
3.4 3.4 6.5 6.8 n/a n/a
3.2 1.9 n/a n/a
Russia
3.4
3.4 5.1
6.9 6.0 5.5
4.0 2.5 -0.4 -0.3
Middle Eastern
Countries
4.8 3.1
10.7 9.6 n/a
n/a
12.5 10.8 -9.7 -9.2
Sub-Saharan Africa
4.8 5.6 9.1
7.2 n/a
n/a
-2.8 -3.5 n/a n/a
South Africa
2.5 2.8 5.7 5.8 25.2 25.7 -6.3 -6.4 -4.8 -4.8
IMF Forecast to the end of 2013 (unless otherwise stated)
n/a not available
Source: International Monetary Fund, World Economic Outlook April 2013 and Update, July 2013
International Monetary Fund, World Economic and Financial Surveys, April 2013
THE INTERNATIONAL ECONOMY


