SOCIAL SECTOR INVESTMENT PROGRAMME
73
SUSTAINING GROWTH, SECURING PROSPERITY
CHAPTER 4: OVERVIEW OF THE SOCIAL SECTOR FOR 2013
Year
Social Infrastructure
TTD
Social Programming
TTD
Total
TTD
2009
3,794,182,115.00
6,054,083,520.00
9,848,265,635.00
2010
3,194,010,000.00
6,223,001,344.00
9,417,011,344.00
2011
3,515,892,000.00
7,101,207,123.00
10,617,099,123.00
2012
3,560,919,000.00
7,868,139,338.00
11,429,058,338.00
2013
3,311,782,000.00
7,834,008,994.00
11,145,790,994.00
Table 4.II:
Budgeted Allocations for Social Infrastructure and Programming for Fiscal 2009-2013
In fiscal 2013, the combined budgeted
allocation for Social Infrastructure and Social
Programming decreased to TTD$11.1 billion
from TTD$11.4 billion in fiscal 2012. This figure
represented a decrease of approximately 2.4%.
Table 4.II outlines the Budgeted Allocation for
Social Infrastructure and Programming 2009-
2013. Appendices I and III are also relevant.
Government’s commitment to meeting the
needs of the social sector was demonstrated
by its investment in social and infrastructural
development initiatives. This investment in
the sector will ensure Trinidad and Tobago’s
achievement of the Millennium Development
Goals and other national development
objectives in a coordinated and sustainable
manner. This includes achieving the targets set
out in the National Performance Framework,
which identifies five (5) key priority areas for
development until 2015. As such, Government
has maintained significant financial investment
in the core Social Sector Ministries and the
Social Service Divisions of the Tobago House of
Assembly.
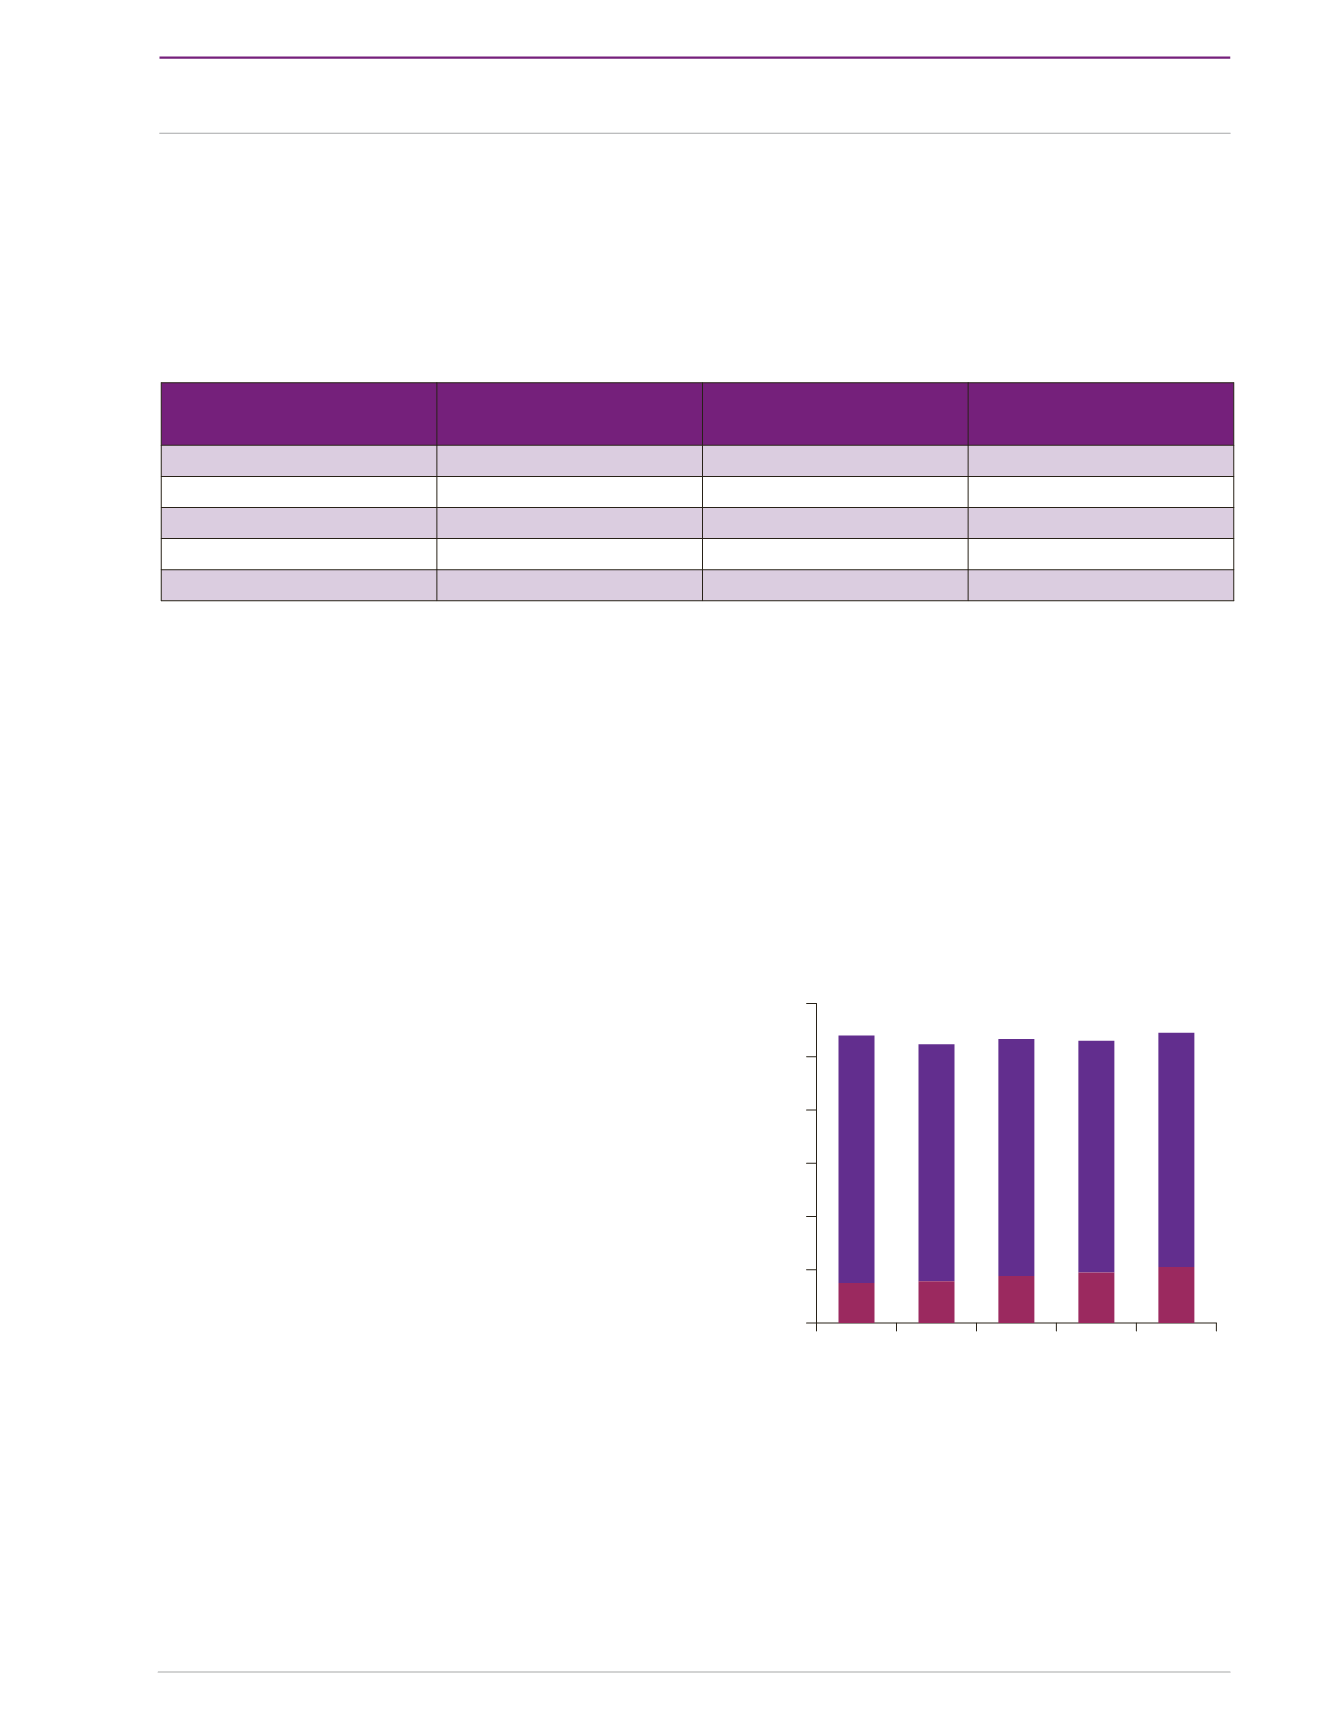
Trinidad and Tobago’s GDP decreased from
TT$93 billion in 2008 to TT$88 billion in 2012.
Despite this, Government’s investment in the
social sector was increased over the period. In
this regard, allocations for social programmes
have increased from TT$15 billion (16.3% of
GDP) in 2008 to TT$22 billion (25% of GDP)
in 2012. Figure 4.IV outlines the allocation to
the social sector in relation to GDP growth over
2007 to 2011.
Figure 4.IV:
Allocation to the Core Social Sector
Ministries and Social Services Divisions
of the THA in Relation to GDP (2008-
2012)
0
20
40
60
80
100
120
2008
2009
2010
2011
2012
TT$ Billions
15
15.7
17.7
19
21
93
89 89
87
88


