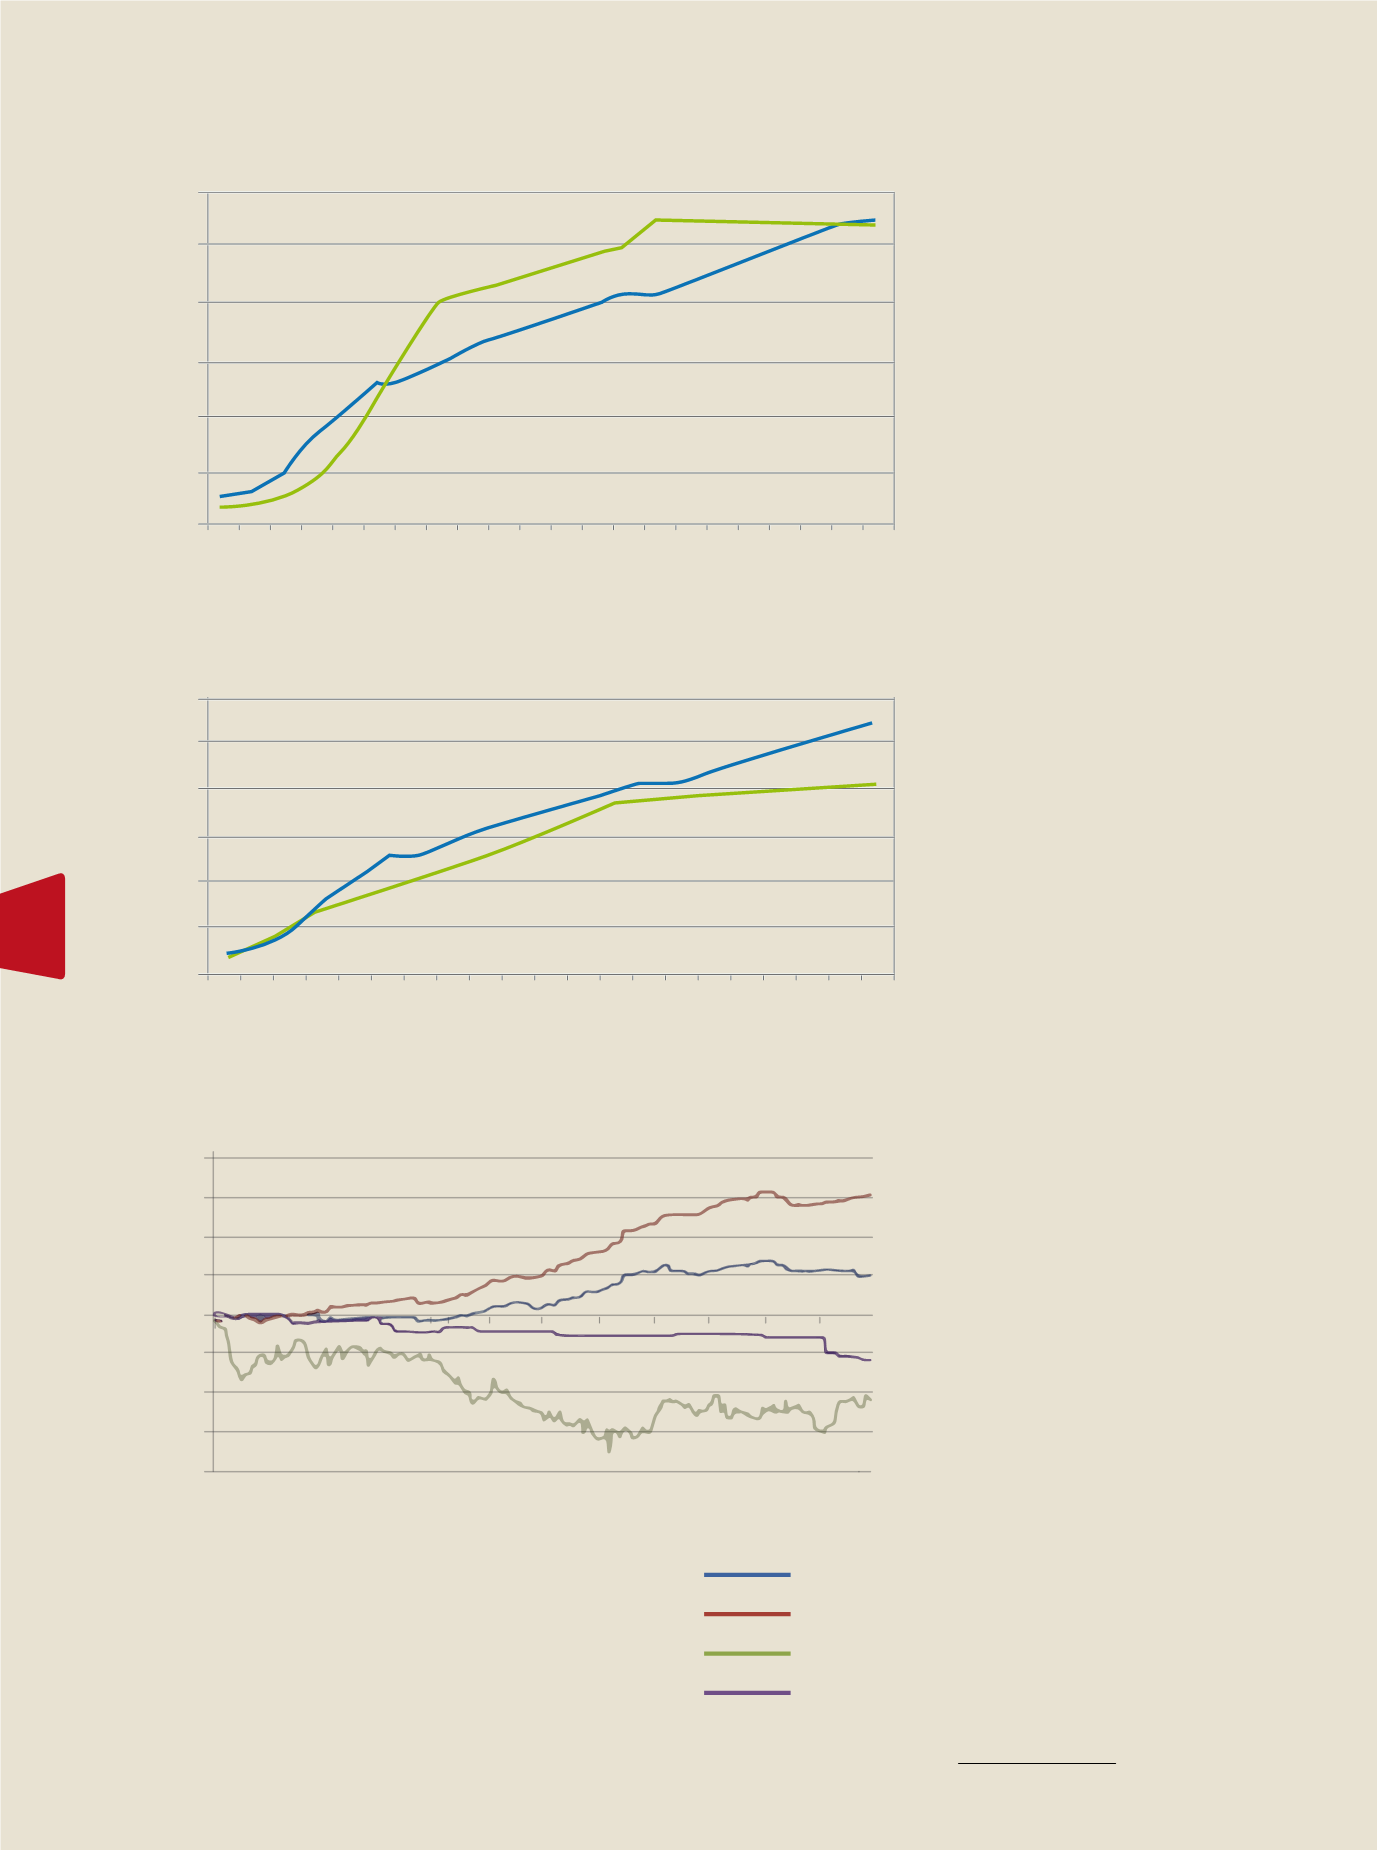
Figure 7:
T&T Government Yield Curve (June Vs Dec 2012)
Figure 8:
Local & Regional Stock Market Performances - FY 2012
3 Months
6 Months
1Year
2Years
3Years
4Years
5Years
6Years
7Years
8Years
9Years
10Years
11Years
12Years
13Years
14Years
15Years
16Years
17Years
18Years
19Years
Trinidad and Tobago Government
Yield Curve - December 2012
Trinidad and Tobago Government
Yield Curve - June 2012
0
1
2
3
4
5
6
Per cent
0.00%
5.00%
-5.00%
10.00%
-10.00%
15.00%
-15.00%
20.00%
-20.00%
3-Jan-12
3-Feb-12
3-Mar-12
3-Apr-12
3-May-12
3-Jun-12
3-Jul-12
3-Aug-12
3-Sep-12
3-Oct-12
3-Nov-12
3-Dec-12
Source: Central Bank of Trinidad and Tobago
Source: Central Bank of Trinidad and Tobago
Figure 6:
T&T Government Yield Curve (Dec 2011 Vs June 2012)
3 Months
6 Months
1Year
2Years
3Years
4Years
5Years
6Years
7Years
8Years
9Years
10Years
11Years
12Years
13Years
14Years
15Years
16Years
17Years
18Years
19Years
20Years
Trinidad and Tobago Government
Yield Curve - December 2011
Trinidad and Tobago Government
Yield Curve - June 2012
0
1
2
3
4
5
6
Per cent
T&T Composite Index
All T&T Index
BSE Local Index
All Jamaica Composite Index
EXECUTIVE DIRECTOR’S LETTER
Unit Trust Corporation
Annual Report 2012
34
ends of the TT Government Yield Curve,
whereas yields improved at the shorter-end
of the curve during 2012. Refer to Figures 6-7.
The domestic and international interest rate
outlook over the next few years is bleak and is
premised on an extended period of low inter-
est rates, offering little relief for such investors.
(Figures 6, 7)
Local & Regional Equity
Market Performance
The Trinidad and Tobago equity market en-
joyed its third consecutive year of positive
returns and outperformed its regional coun-
terparts.
Figure 8
refers. The T&T Composite
and All T&T Indices posted returns of 5.14
percent and 15.5 percent
1
respectively, while
the Cross Listed Index generated a negative
return of 13.68 percent for calendar 2012.
Total market capitalization as at December
31, 2012 stood at TT$97.35 billion, compared
to TT$94.47 billion a year ago. The market
was less active in 2012 relative to the preced-
ing year with a total of 8,778 trades and a
volume of 50.68 million shares crossing the
floor, valued at TT$746.6 million. This com-
pares to 9,188 trades and a volume of 564.06
million shares valued at TT$1.029 billion in
2011. The top performing sectors included:
Manufacturing I which gained 30.07 percent,
Trading with a gain of 24.80 percent, and
Conglomerates which added 12.26 percent.
Market laggards included the Property and
Manufacturing II sectors which returned
negative 21.94 percent and negative 19.35
percent respectively.
The other major regional stock indices un-
derperformed in 2012. The JSE Market Index
lost 3,195.98 points or 3.35 percent while the
JSE All Jamaican Composite Index declined
by 11,017.19 points or 10.78 percent over the
year. Market volumes were also lower in 2012
with a total of 19,492 trades and 1.43 billion
shares exchanging hands valued at J$18.30
billion compared to 23,293 trades and a vol-
ume of 1.55 billion shares valued at J$18.10
billion in the preceding year.
1 The YTD returns provided here refer only to capital
appreciation and thus exclude dividend yield.


