20.00%
5.14%
TT Composite
AII T$T
TT Cross Listed
JSE AII Jamaican Composite
JSE AII Market Index
JSE AII Cross Listed
BSE Local
BSE Cross Listed
BSE Junior
15.5%
-19.54% -3.4% -10.8%
10.0%
12.9%
1.1%
-5.7%
-20.00%
-25.00%
15.00%
-15.00%
10.00%
-10.00%
5.00%
-5.00%
0.00%
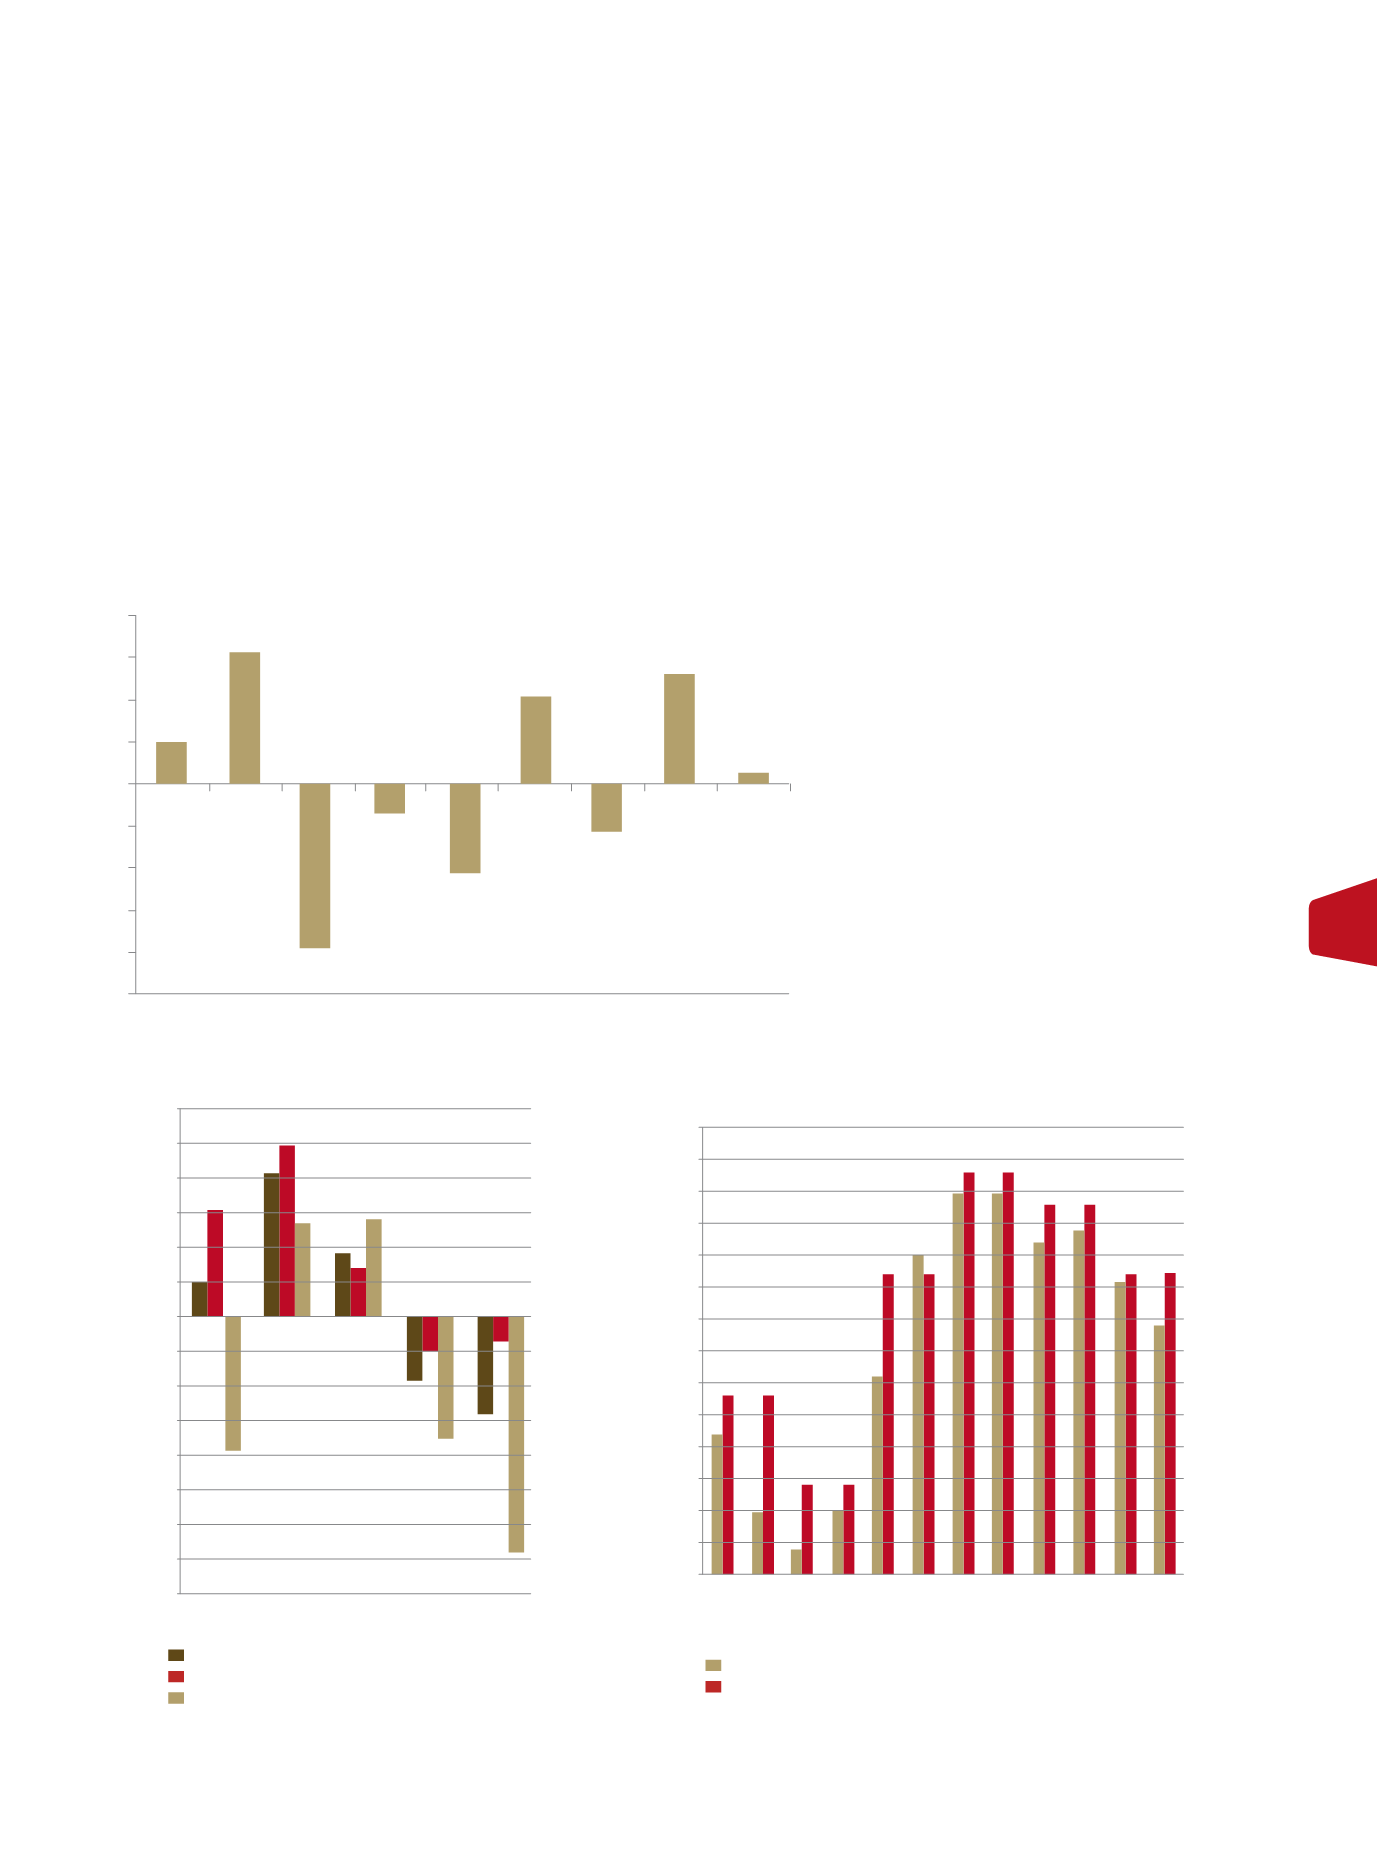
Figure 2: 2012 Regional Stock Indices Returns
0.00%
0.05%
0.10%
0.15%
0.20%
0.25%
0.30%
0.35%
0.40%
0.45%
0.50%
0.55%
0.60%
0.65%
0.70%
Jan-12
Feb-12
Mar-12
Apr-12
May-12
Jun-12
Jul-12
Aug-12
Sep-12
Oct-12
Nov-12
Dec-12
20.00%
30.00%
25.00%
-20.00%
-25.00%
-30.00%
-35.00%
-40.00%
15.00%
-15.00%
10.00%
-10.00%
5.00%
-5.00%
0.00%
2012
2011 2010 2009 2008
2012
2011 2010 2009 2008
Figure 3: T&T Stock Market Returns 2008-2012
Figure 4: T&T Treasury Bill Rates 2012
TT Comp Index
AII TT Index
3 Month T Bill
Cross Listed Index
6 Month T Bill
Chairman’s Review
Unit Trust Corporation
Annual Report 2012
27
growth is expected to be negative, with fiscal
challenges leading to Grenada debt going
into selective default in March 2013. Overall,
the Caribbean region grew by 1.1% in 2012 in
comparison to 3.3% in 2011.
In Trinidad and Tobago, economic activi-
ty picked up in the third quarter, with GDP
growth of 1.5% following a contraction of 3.3
percent in the previous quarter. Growth was
driven by the non-energy sector, particularly
Trading & Distribution, Financial Services and
continue to depress short-term interest rates.
Excess liquidity was roughly TT$3.97 billion at
the end of 2012.
The maintenance of a low interest rate en-
vironment positively impacted borrowing
costs. As a result, the bond market saw a
marked increase in activity during the sec-
ond half of 2012. Primary bond issues totaled
twelve for the year valued at TT$4.3 billion,
with only one in the first half. This compares
to twenty issues in 2011, valued at TT$7.2
billion. On the secondary market, there were
67 transactions valued at TT$1.38 billion, the
bulk of which occurred in December. This
represents a significant improvement over
that seen in 2011 when a total of 46 trades
were effected valued at TT$177 million.
Activity on the local stock market picked
up from where it left off in 2011, as the
Composite Index and All T&T Index rallied
5.14% and 15.5% respectively. Regional
stocks however did not fare so well as the
Cross Listed Index fell 19.5%.
Construction. Energy sector GDP was less re-
silient, increasing by a mere 0.50% year-over-
year and reflected the reduction in crude oil,
natural gas and petrochemical production.
Several scheduled downstream energy pro-
jects were also put on hold.
The financial landscape continues to be char-
acterized by low interest rates and liquidity
build ups. High levels of excess liquidity, sus-
tained by weak private sector credit demand
and high net domestic fiscal injections,


