1.000
10.000
10.500
11.000
11.500
12.000
13.000
12.500
1.050
1.100
1.150
1.200
1.250
1.300
1.350
1.400
1.450
1.500
9-Dec-11
9-Jan-12
9-Feb-12
9-Mar-12
9-Apr-12
9-May-12
9-Jun-12
9-Jul-12
9-Aug-12
9-Sep-12
9-Oct-12
9-Nov-12
9-Dec-12
0
5.000
10.000
15.000
20.000
25.000
100
105
110
115
120
125
130
135
12-Feb-12
12-Mar-12
12-Apr-12
12-May-12
12-Jun-12
12-Jul-12
12-Aug-12
12-Sep-12
12-Oct-12
12-Nov-12
12-Dec-12
12-Dec-11
5.000
6.000
7.000
8.000
9.000
10.000
11.000
30.000
32.000
34.000
36.000
38.000
40.000
42.000
44.000
46.000
9-Dec-11
9-Jan-12
9-Feb-12
9-Mar-12
9-Apr-12
9-May-12
9-Jun-12
9-Jul-12
9-Aug-12
9-Sep-12
9-Oct-12
9-Nov-12
9-Dec-12
4.000
6.000
8.000
10.000
12.000
14.000
16.000
18.000
800
850
900
950
1.000
1.050
1.100
1.150
1.200
9-Dec-11
9-Jan-12
9-Feb-12
9-Mar-12
9-Apr-12
9-May-12
9-Jun-12
9-Jul-12
9-Aug-12
9-Sep-12
9-Oct-12
9-Nov-12
9-Dec-12
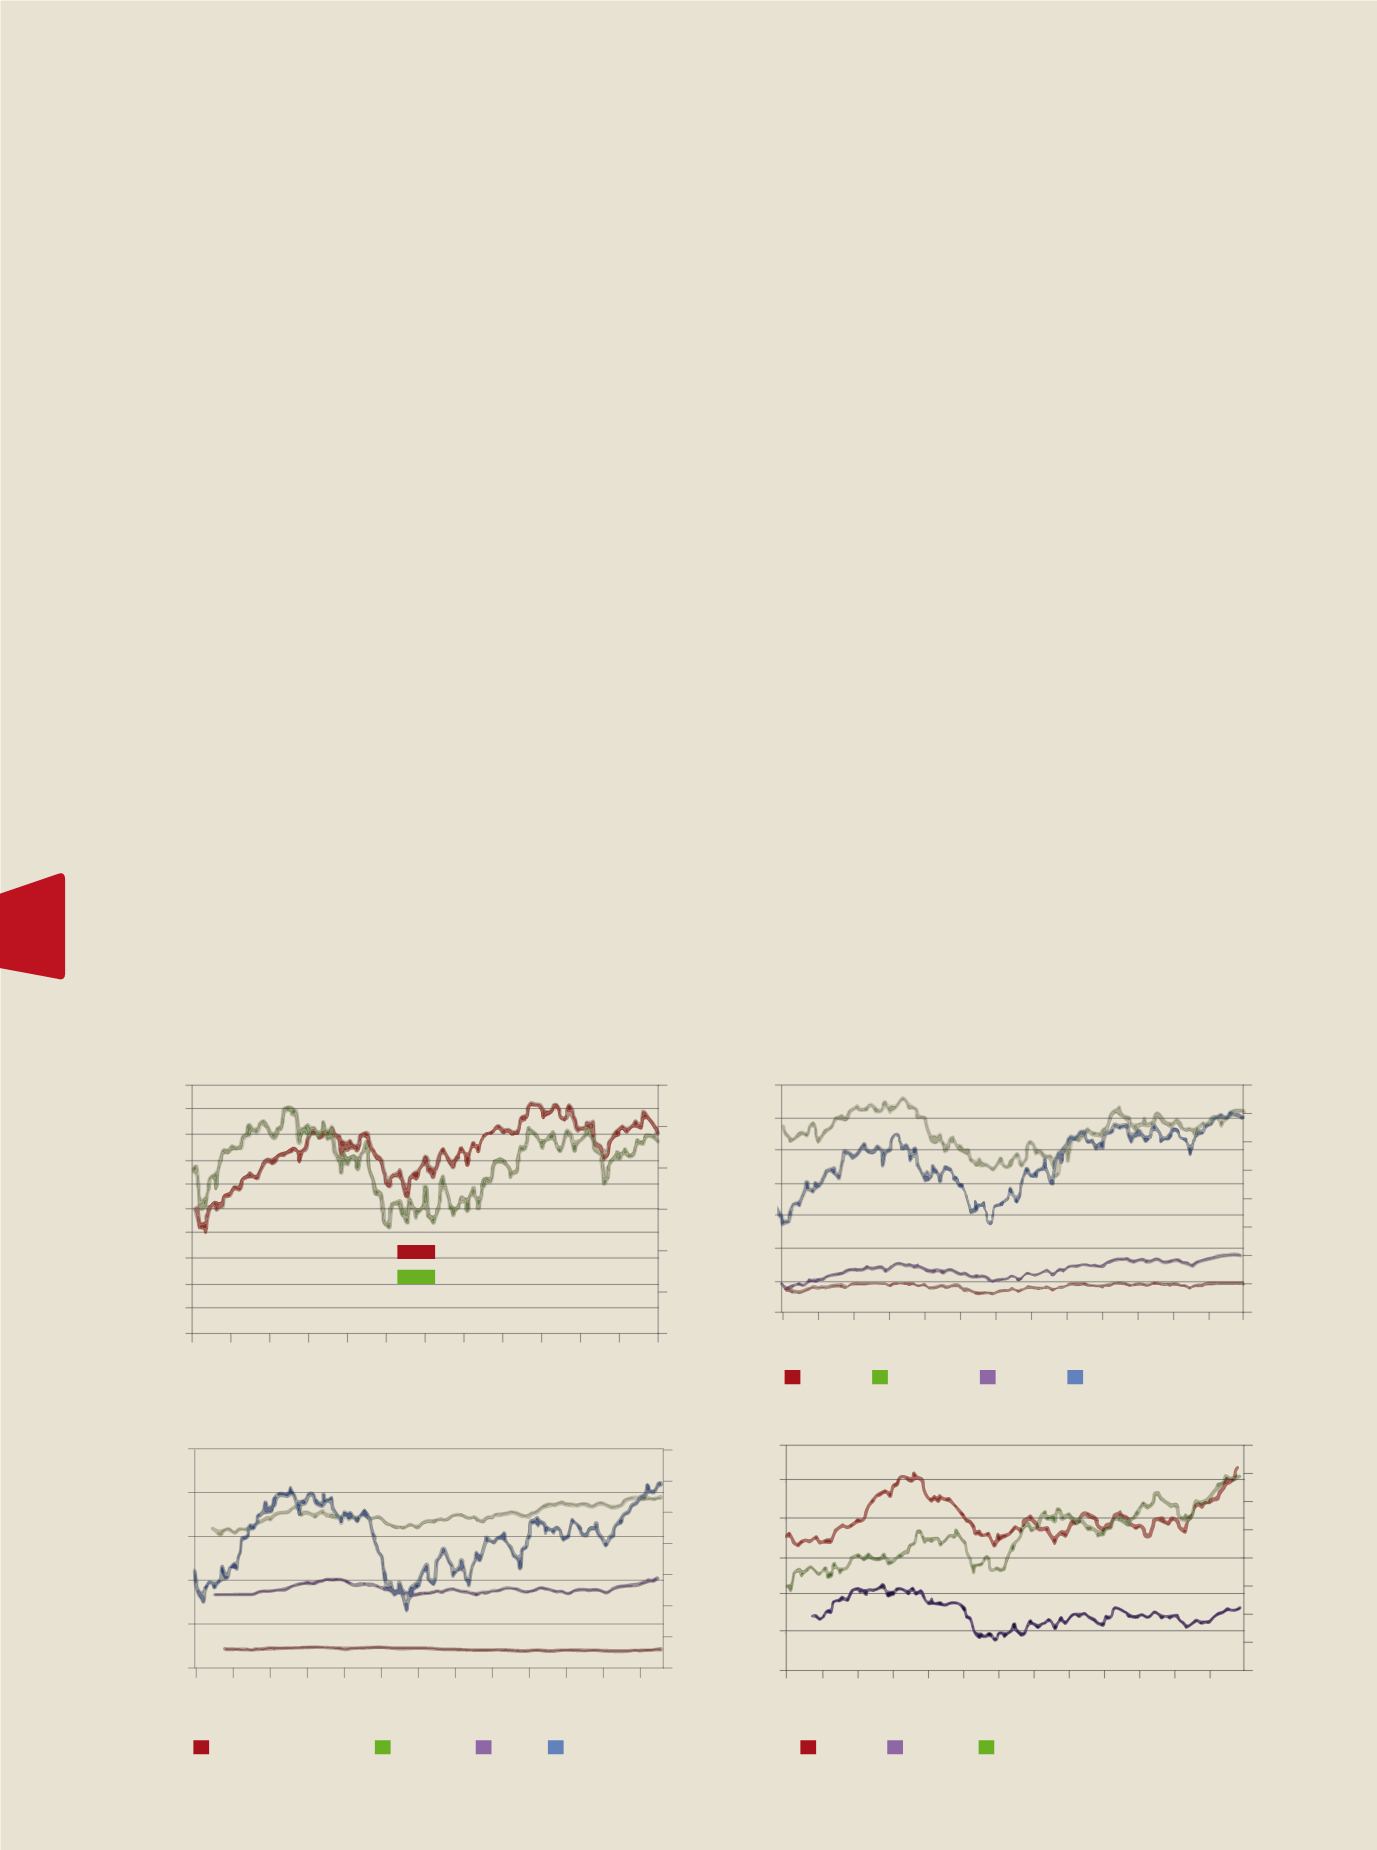
Figure 1:
North American Equity Indices
S&P 500
FTSE
Shanghai SE Composite
Bovespa
DAX
Nikkel
S&P LAC
S&P TSX Composite Index
FTSE MIB
BSE Sensex
Mexico Bolsa IPC
S&P 350 Europe
MSCI Asia pacific
S&P 500 Index
S&P TSX Composite Index
MSCI Asia Pacific Index
Mexico Bolsa IPC Index
S&P 350 Europe Index
Figure 2:
European Equity Indices
Figure 3:
Asian Equity Indices
Figure 4:
Latin American Equity Indices
EXECUTIVE DIRECTOR’S LETTER
Unit Trust Corporation
Annual Report 2012
32
Emerging market economic conditions were
tempered by the Euro-area recession as these
regions depend heavily on that area’s external
demand. The Asian region still managed to
grow at a rate of 6.28 percent in 2012 com-
pared to 7.54 percent in 2011, while Latin
America grew at 2.57 percent compared to
4.17 percent in 2011. These regions’ largest
economies, China and Brazil, grew at 7.80 per-
cent and 0.87 percent respectively in 2012.
Turning our attention to the Caribbean, many
of the region’s tourism intensive economies
continued to face challenges of elevated
public debt levels, weak external demand,
and adverse terms of trade. The Jamaican
economy encountered continued difficulties
in 2012, however, in February 2013, Jamaican
authorities and the International Monetary
Fund (IMF) reached a staff-level agreement
for an Extended Fund Facility which should
provide some support in the medium term.
Barbados’ economic growth stagnated in
2012 as the economy remains challenged
owing to the protracted global economic
weakness which significantly impacts tour-
ism. In contrast, the region’s key commodity
exporters, Guyana and Suriname, were more
resilient and are expected to post moderate
economic growth of 3.9 percent and 4.0 per-
cent respectively for 2012.
TheCentral Bank ofTrinidad&Tobago forecasts
GDP growth of 1.2 percent and 2.5 percent
for 2012 and 2013 respectively. Third quarter
GDP for 2012 grew by 1.5 percent year-over-
year following a 3.3 percent contraction in the
preceding quarter. Crude, natural gas and pet-
rochemical production all deteriorated during
the year and various downstream energy pro-
jects were postponed. Notably, however, there
was increased exploratory and drilling activity
in the upstream energy sector during 2012
along with new oil and gas finds.
In January 2013, the IMF revised its 2013
projection for world growth to 3.5 percent,
marginally lower than its October 2012 fore-
cast of 3.6 percent. World trade is expected to
decelerate further, expanding at a pace of 3.8
percent in 2013 following 2.8 percent growth
in 2012. Commodity prices are also expected
to ease, while inflation should remain stable
in the developed economies though rising
slightly in the emerging market and develop-
ing economies. Any substantial deterioration
in economic conditions for either of these
economies would suggest negative implica-
tions for global economic growth.
Financial Markets-
International Equity Performance
Equity markets posted solid returns in 2012,
outperforming fixed-income markets as in-
vestors sought to purchase risk assets despite
the uncertainties of the economic issues
dominating the headlines. In North America,
the US benchmark S&P 500 Index rose 13.41
percent for the year, compared to return of 0.0
percent in 2011. The Financial sector was the
year’s best performer returning 26.26 percent
followed by the Consumer Discretionary and
Healthcare sectors which saw gains of 21.87
percent and 15.19 percent respectively. The
sole US sector showing a negative return was
the Utilities sector, the worst performer for
the year. The Energy sector was the second
worst performer returning 2.33 percent.
Industries within the Energy sector exhibited
mixed performance with the best performer,
the S&P Oil and Gas Refining and Marketing
Index, rising a magnificent 80.07 percent


