REVIEW OF THE ECONOMY 2013
48
SUSTAINING GROWTH, SECURING PROSPERITY
WASA, TSTT and the Trinidad and Tobago
Electricity Commission (T&TEC) were the
three major contributors to Capital Expenditure
undertaken by Public Utilities for the first seven
months of fiscal 2013. WASA accounted for the
greatest proportion of Capital Expenditure with
$369.6million, followed byTSTT ($351.5million)
and T&TEC ($35.9 million).
CAPITAL TRANSFERS FROM
CENTRAL GOVERNMENT
In the seven months to April 2013, Capital
Transfers fromCentral Government to theRest of
the Non-Financial Public Sector totalled $787.8
million, an increase of 67.4 percent from the
$470.6 million transferred in the corresponding
period of the previous year.
Capital Transfers to Public Utilities totalled
$635.5 million of which $473.1 million was
utilised for debt servicing. Of the $635.5 million,
WASA accounted for $491.9 million, AATT
$119.8 million, and the Port Authority of Trinidad
and Tobago (PATT) $23.8 million. Of the $152.3
million in Capital Transfers disbursed to State
Enterprises, UDeCOTT received the major share
of $137.6 million, while MTS received $14.7
million.
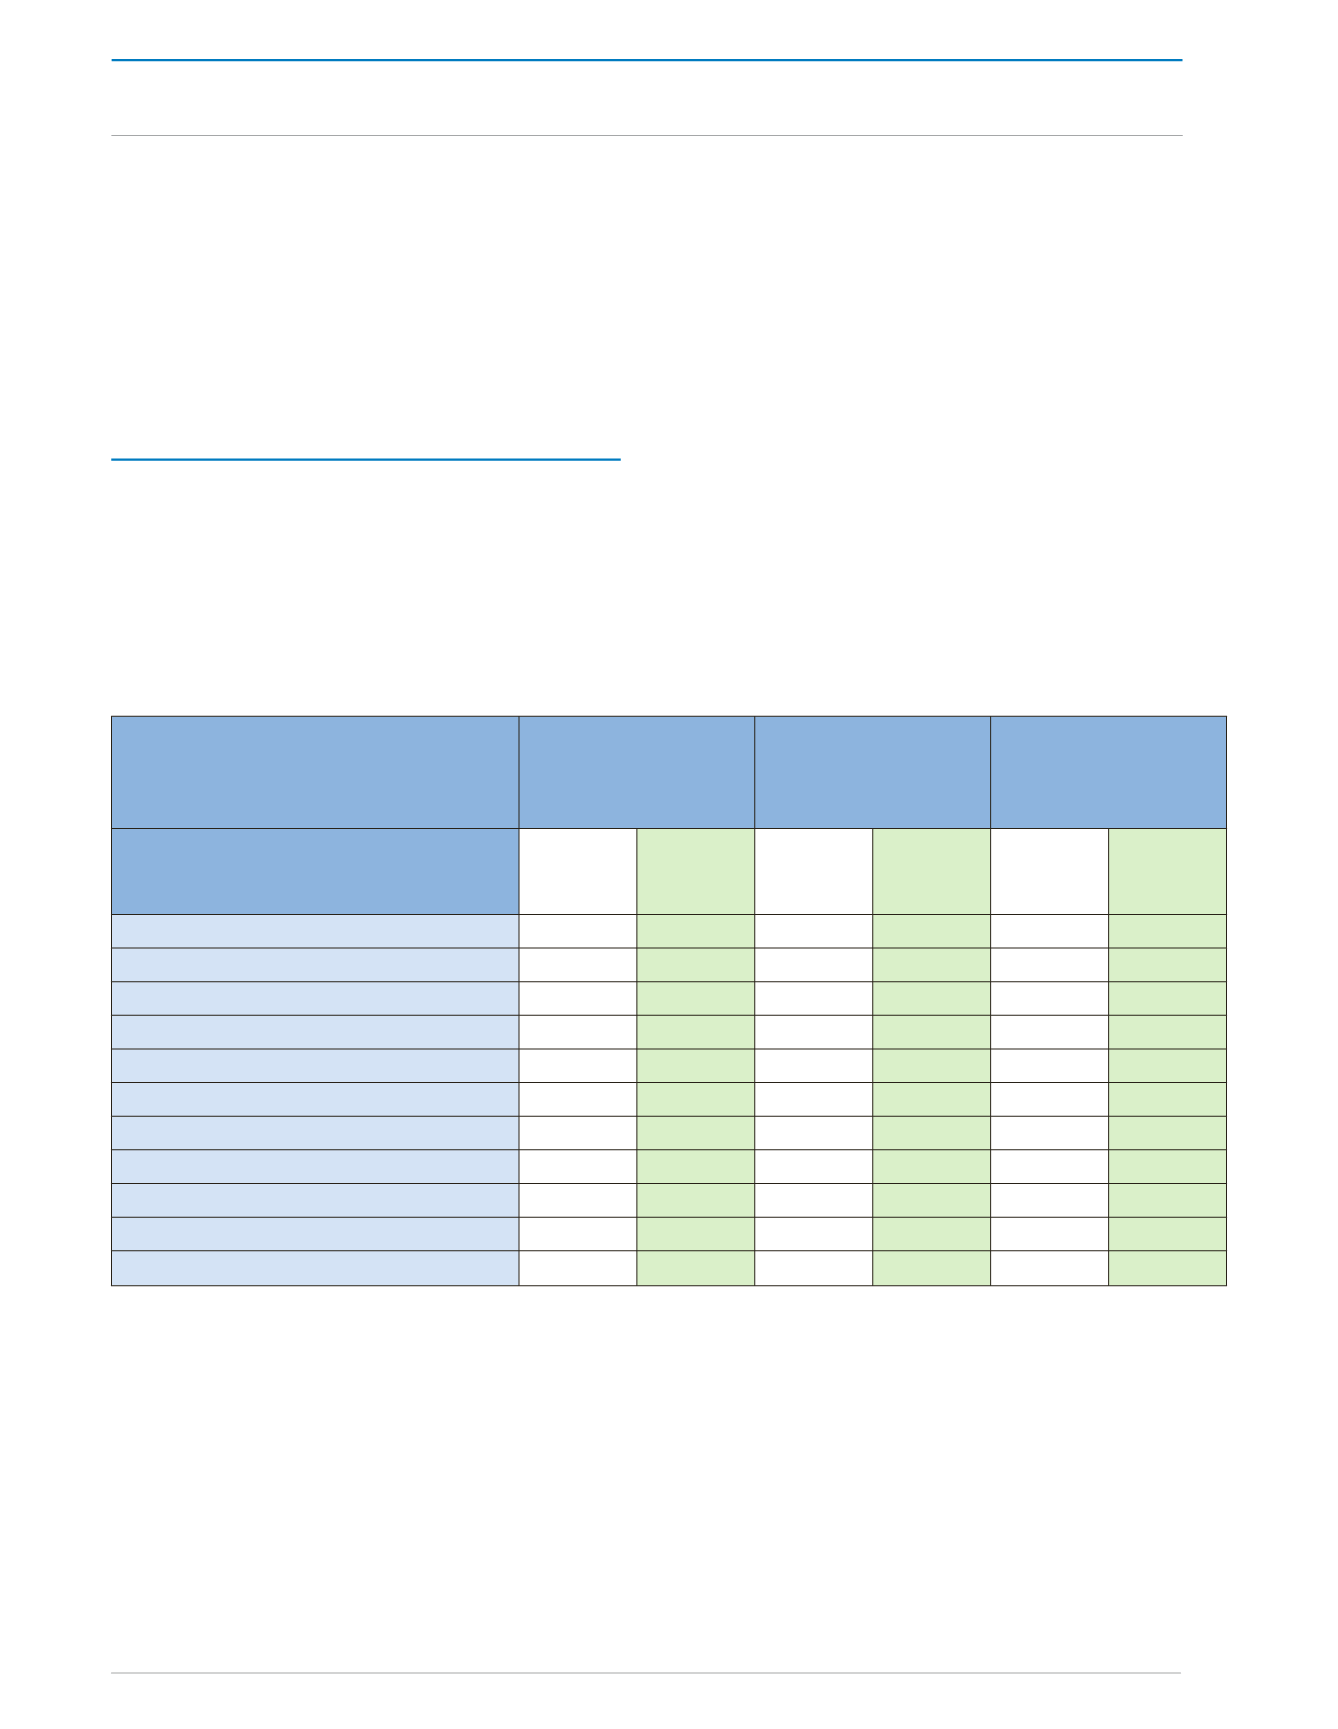
Table 7:
Cash Statement of Operations of the Rest of the Non-Financial Public Sector
State Enterprises
Public Utilities
Total
State Enterprises
and
Public Utilities
(TT $ millions)
Oct 2011-
Apr 2012
Oct
2012- Apr
2013
Oct 2011-
Apr 2012
Oct
2012- Apr
2013
Oct 2011-
Apr 2012
Oct 2012-
Apr 2013
Operating Revenues
37,914.4 38,772.1 4,234.7 4,509.5 42,149.1 43,281.6
Operating Expenditures
34,086.2 32,996.1 4,993.7 5,436.2 39,079.9 38,432.3
Operating Surplus/(Deficit)
3,828.3 5,776.0 -759.1
-926.7 3,069.2 4,849.3
Current Transfers from Central Gov't
483.9 444.2 1,130.2 1,201.5 1,614.1
1,645.7
Current Balance
2,970.1 2,370.3 494.7
310.4 3,464.8 2,680.7
Capital Expenditure
3,027.7 2,675.9 578.4 790.2 3,606.1
3,466.1
Capital Transfers from Central Gov't
102.8 152.3
367.8 635.5
470.6
787.8
Overall Balance
183.3
113.5 286.6 160.4 469.9 273.9
Financing
-183.3 -113.5 -286.6 -160.4 -469.9 -273.9
Net Foreign Financing
-616.4
20.8
-16.4
-31.1
-632.8
-10.3
Net Domestic Financing
433.1
-134.3 -270.2 -129.3
162.9 -263.6
1.
Table refers to fiscal years
2.
State Enterprises refer to the consolidated operations of thirteen (13) companies namely: National Maintenance Training & Security
Co. (MTS), National Gas Co. (NGC), National Helicopter Services Ltd. (NHSL), National Quarries Co. Ltd. (NQCL), National Petro-
leumMarketing Co. (NPMC), Petroleum Co. of Trinidad & Tobago (PETROTRIN), Trinidad & Tobago Mortgage Finance Co. (TTMF),
Point Lisas Development Co. (PLIPDECO), SolidWaste Management Co. Ltd. (SWMCOL), Trinidad Nitrogen Co. Ltd. (TRINGEN), Ur-
ban Development Corp. of Trinidad & Tobago (UDeCOTT), Vehicle Management Corp. of Trinidad & Tobago (VMCOTT), and National
Infrastructure Development Co. (NIDCO).
3.
Public Utilities refer to the consolidated operations of six (6) companies namely: Airports Authority of Trinidad & Tobago (AATT),
Port Authority of Trinidad & Tobago (PATT), Public Transport Service Corp. (PTSC), Telecommunications Services of Trinidad &
Tobago (TSTT), Trinidad & Tobago Electricity Commission (TTEC), andWater & Sewerage Authority (WASA).
4.
For the following companies, the most available data was used: NQCL (Dec 2012); UDeCOTT (Feb 2013);
5.
No information was received for Fiscal 2013 for VMCOTT;
6.
Totals may vary due to rounding.
REST OF THE NON-FINANCIAL PUBLIC SECTOR OPERATIONS


