REVIEW OF THE ECONOMY 2013
85
SUSTAINING GROWTH, SECURING PROSPERITY
APPENDICES
APPENDIX 23
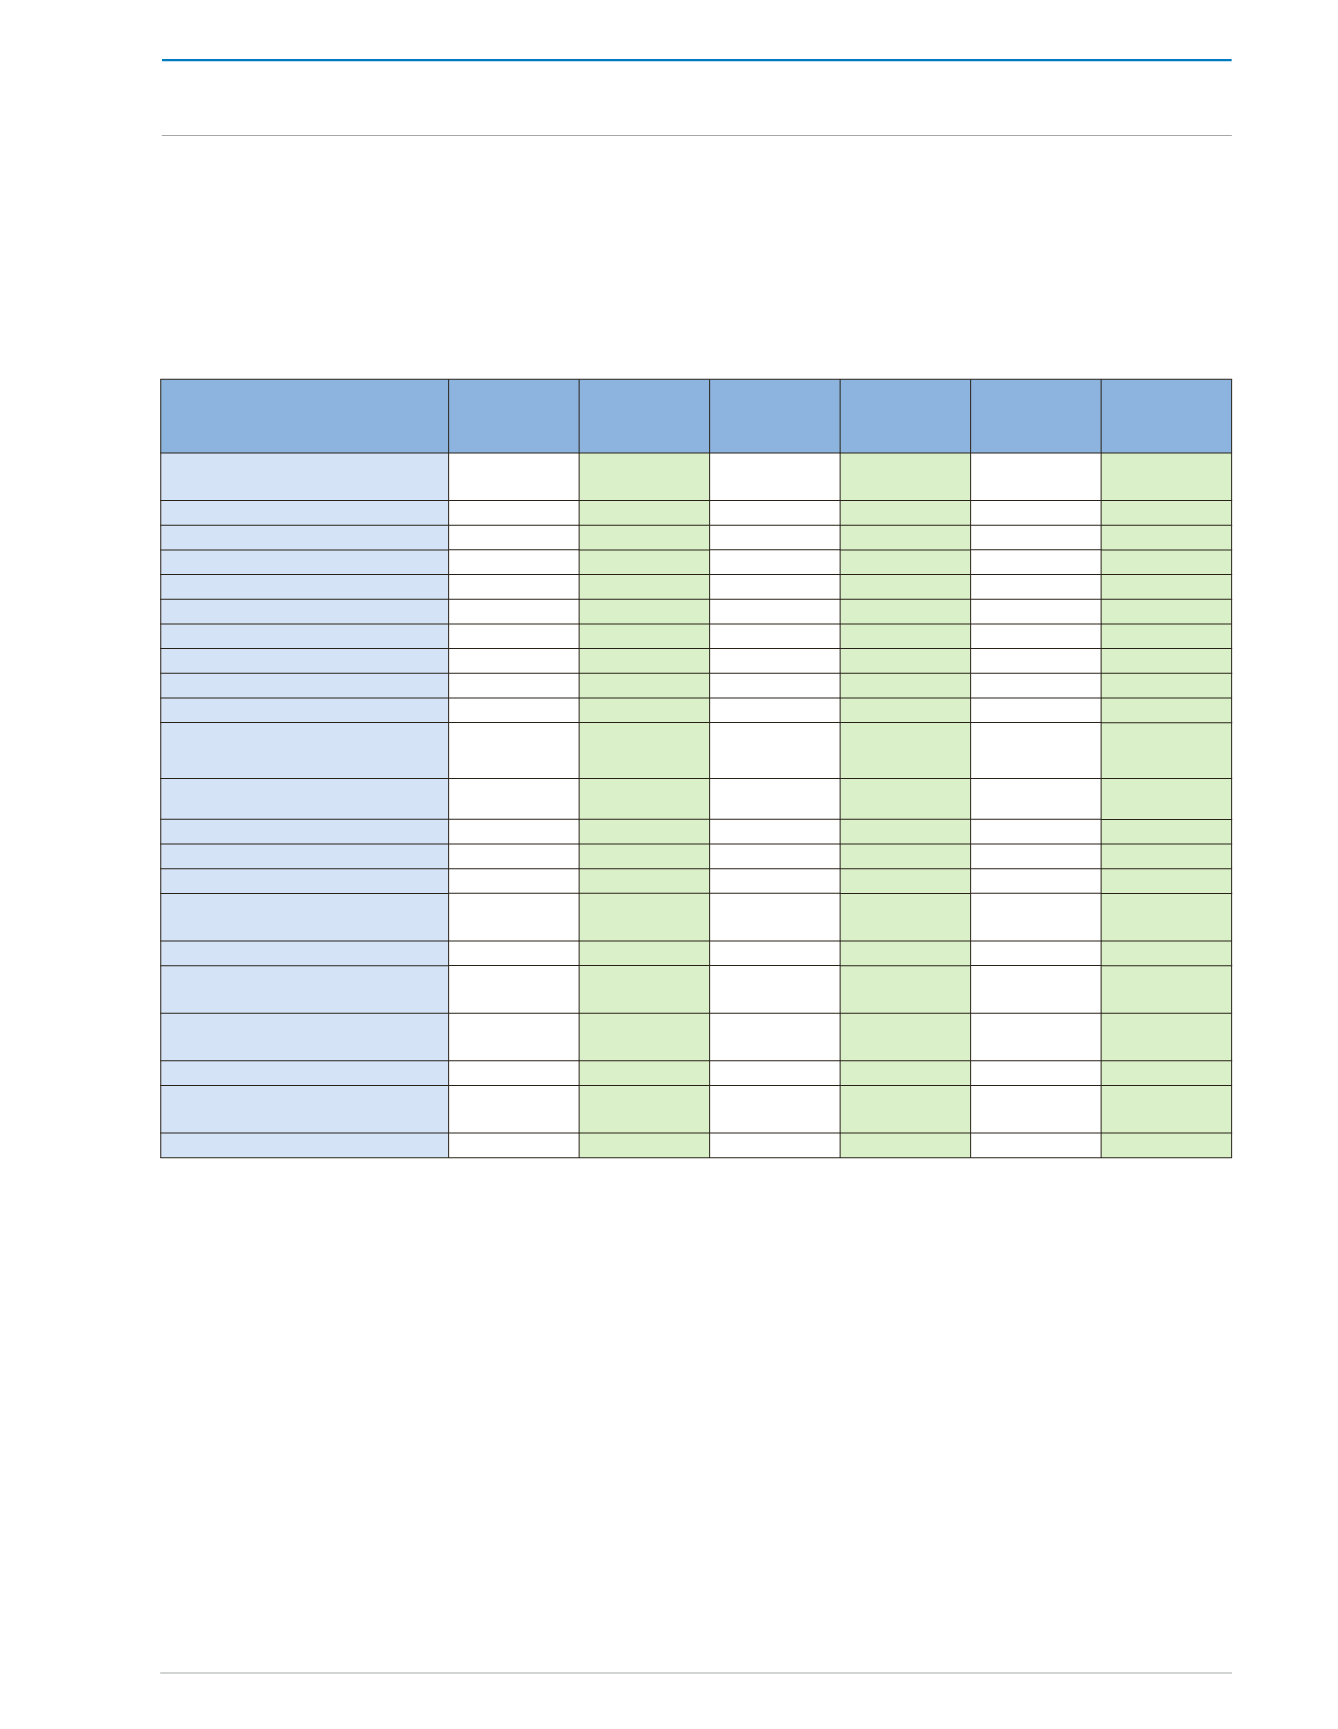
CENTRAL GOVERNMENT EXPENDITURE AND NET LENDING
/TT$ MILLIONS/
Oct '07/
Sep '08
Oct '08/
Sep '09
Oct '09/
Sep '10
Oct '10/
Sep '11
Oct '11/
Sep '12
r
Oct '12/
Sep '13
p
Total Expenditure and Net
Lending
53,873.3 45,730.8 46,701.4 51,492.4 52,806.9 59,470.2
Recurrent Expenditure
43,738.8 36,683.4 40,302.2 43,914.9 45,068.9 50,467.1
Wages and Salaries
6,946.9 6,620.3
6,711.0
7,179.7
7,282.3
9,618.8
Goods & Services
5,002.4 6,023.0 6,441.2 6,504.3
7,061.6
7,969.3
Interest Payments
2,967.3 3,499.9 3,290.3 2,866.4
2,937.1
3,063.7
of which:-
Domestic
2,329.6
2,955.3
2,846.1
2,486.9
2,547.9
2,512.1
Foreign
637.7
544.6
444.2
379.5
389.2
551.6
Subsidies & Transfers
28,822.2 20,540.2 23,859.7 27,364.5 27,787.9 29,815.3
Capital Expenditure and Net
Lending
10,134.5
9,047.4 6,399.2
7,577.5
7,738.0 9,003.1
of which:-
Development Programme
(PSIP)
4,302.8
3,549.2
3,009.3
3,276.6
3,335.8
3,582.9
Infrastructure Development
Fund
5,329.6
4,952.9
3,348.4
3,552.3
3,683.9
4,685.3
GATE
450.0
633.5
625.0
624.9
750.3
757.9
Acquisition of Foreign Fixed
Assets
75.6
33.5
71.2
159.0
0.0
0.0
Net Lending
-23.5
-121.7
-29.7
-35.3
-32.0
-23.0
Source: Budget Division, Ministry of Finance and the Economy
r : revised
p : provisional


