REVIEW OF THE ECONOMY 2013
89
SUSTAINING GROWTH, SECURING PROSPERITY
APPENDICES
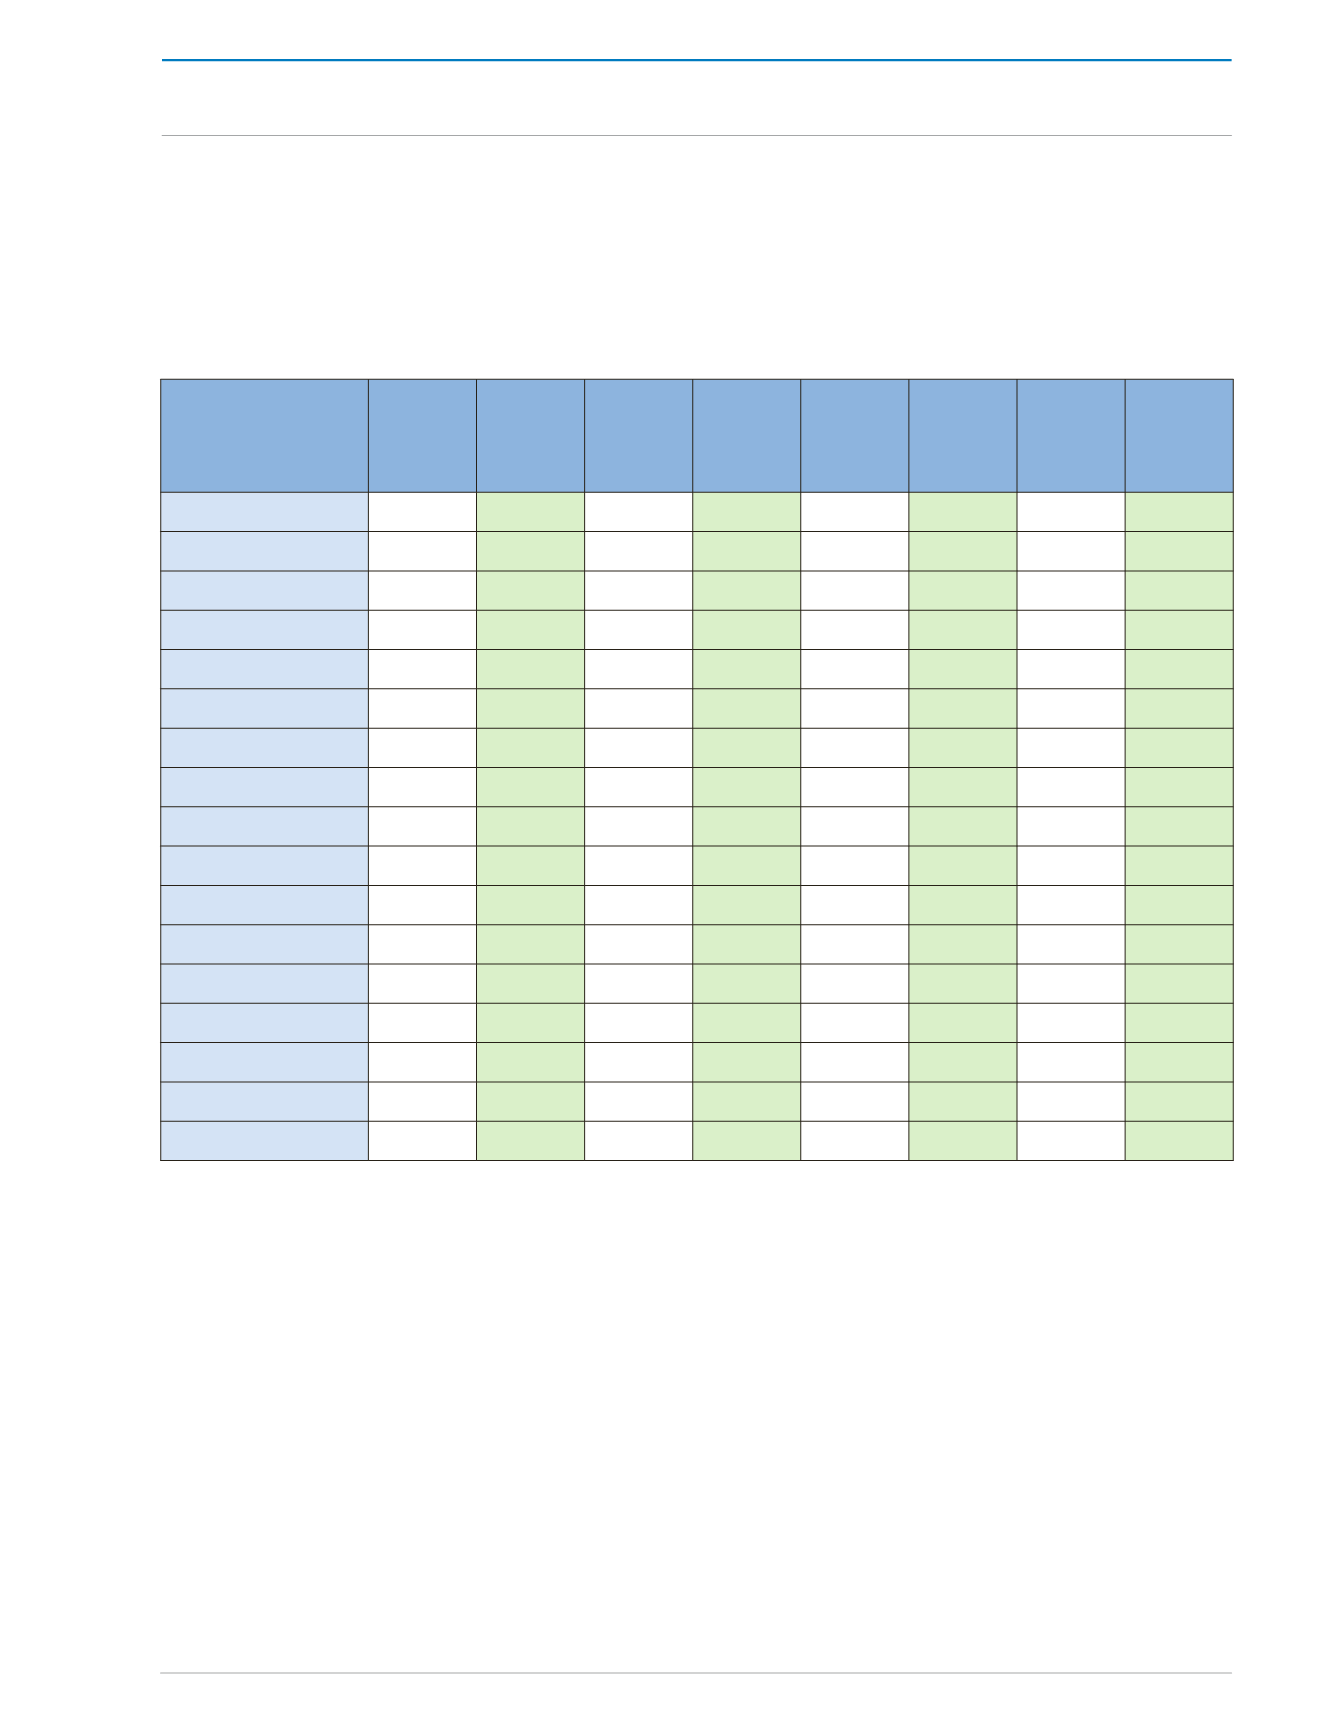
Imports Exports
Balance of
Trade
Exports
of Mineral
Fuels
Imports
of Mineral
Fuels
Imports
Excluding
Mineral
Fuels
Exports
Excluding
Mineral
Fuels
Balance
of Trade
Excluding
Mineral
Fuels
1998
668.8
4,309.9
3,641.1
1,827.6
248.7
420.1
2,482.3 2,062.2
1999
827.9
4,708.1
3,880.2 2,323.3
454.6
373.3
2,384.8
2,011.5
2000
791.2
6,284.4 5,493.2 3,880.3
399.9
391.3
2,404.1
2,012.8
2001
750.8
6,415.2 5,664.4 3,808.7
218.2
532.6
2,606.5 2,073.9
2002
574.4
5,152.0 4,577.6 2,531.9
167.6
406.8
2,620.1
2,213.3
2003
588.9
6,585.5 5,996.6 4,146.8
69.0
519.9
2,438.7
1,918.8
2004
634.6
5,620.7
4,986.1
2,954.4
87.5
547.1
2,666.3
2,119.2
2005
700.2
13,153.1
12,452.9 9,931.0
126.6
573.6
3,222.1
2,648.5
2006
611.1
15,528.3 14,917.2 12,027.2
158.7
452.4
3,501.1
3,048.7
2007
762.3
11,462.3 10,700.0 7,571.5
177.9
584.4
3,890.8 3,306.4
2008
772.0 21,231.8 20,459.8 16,994.9
146.5
625.5
4,236.9
3,611.4
2009
700.0
9,141.4
8,441.4 5,945.8
101.7
598.3
3,195.6 2,597.3
2010
793.2
13,238.6 12,445.4 10,506.2
141.0
652.2
2,732.4 2,080.2
2011
r
1,545.8 13,442.5 11,896.7
9,630.5
218.8
1,327.0
3,812.0 2,485.0
2012
p
1,386.4
11,085.9 9,699.5
7,393.9
450.8
935.6
3,692.0 2,756.4
Oct '11/Jun '12
967.0
5,004.6 4,037.6 2,186.7
226.5
740.5
2,817.9
2,077.4
Oct '12/Jun '13
927.1
15,082.5 14,155.4 11,991.4
357.1
570.0
3,091.1
2,521.1
Source: Central Statistical Office
r: revised
p: provisional
APPENDIX 27
TRADE WITH CARICOM COUNTRIES
/TT$ MILLIONS/


