REVIEW OF THE ECONOMY 2013
82
SUSTAINING GROWTH, SECURING PROSPERITY
APPENDICES
APPENDIX 20
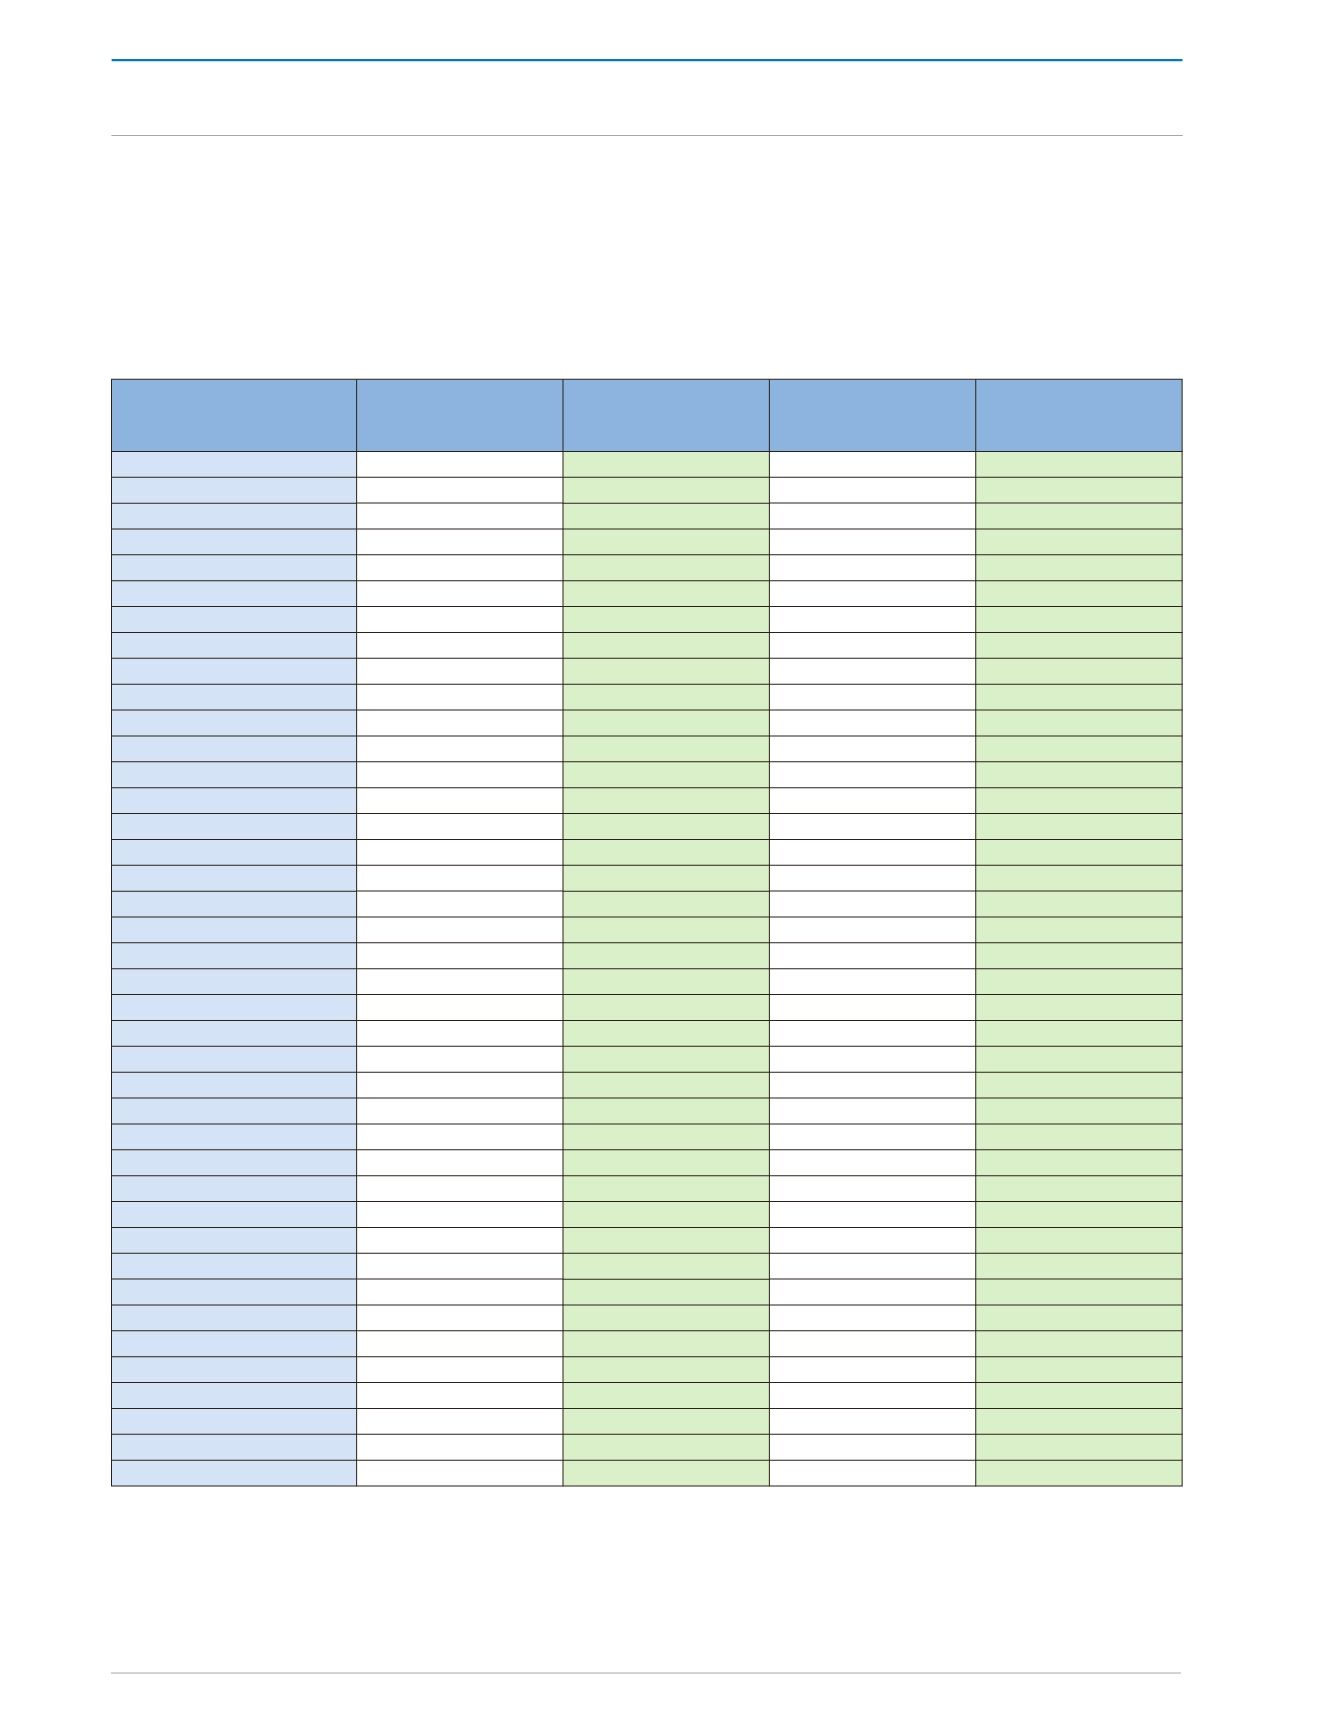
SECONDARY MARKET ACTIVITIES
Period Ending
Number of
Transactions
Volume of Shares
Traded (Mn)
Market Value ($Mn)
Composite Index
(Period End)
2001
6,609
122.2
1,045.0
434.2
2002
8,092
96.6
1,060.3
545.6
2003
16,690
409.6
2,303.2
694.1
2004
36,078
311.2
3,015.8
1,074.6
2005
32,316
193.5
3,918.1
1,067.4
2006
20,772
218.9
2,463.2
969.2
2007
17,733
119.4
2,138.1
982.0
2008
22,053
134.9
2,191.1
842.9
2009
9,884
76.9
1,474.2
765.3
2010
8,496
76.7
864.5
835.6
2011
9,200
563.9
1,032.0
1,012.9
2012
8,778
50.7
746.6
1,065.0
2011
October
630
2.4
42.7
989.8
November
762
9.4
75.3
1,004.9
December
514
2.5
37.0
1,012.9
2012
January
755
6.2
42.8
1,009.9
February
555
2.4
25.8
1,017.9
March
766
5.3
102.6
1,011.6
April
664
4.9
62.8
1,007.8
May
859
3.9
59.5
1,018.9
June
750
4.4
43.2
1,022.4
July
860
3.5
106.4
1,044.2
August
945
4.8
66.2
1,070.3
September
765
4.2
68.1
1,066.4
October
781
3.3
69.1
1,084.5
November
594
4.0
63.8
1,071.3
December
484
3.8
36.3
1,065.0
2013
January
823
4.7
59.3
1,078.6
February
640
3.2
72.8
1,088.1
March
794
8.6
115.6
1,095.9
April
730
7.4
58.8
1,106.2
May
1,216
11.7
102.5
1,121.7
June
736
4.9
78.9
1,127.2
Source: Central Bank of Trinidad and Tobago and Trinidad and Tobago Stock Exchange


