REVIEW OF THE ECONOMY 2013
75
SUSTAINING GROWTH, SECURING PROSPERITY
APPENDICES
APPENDIX 13
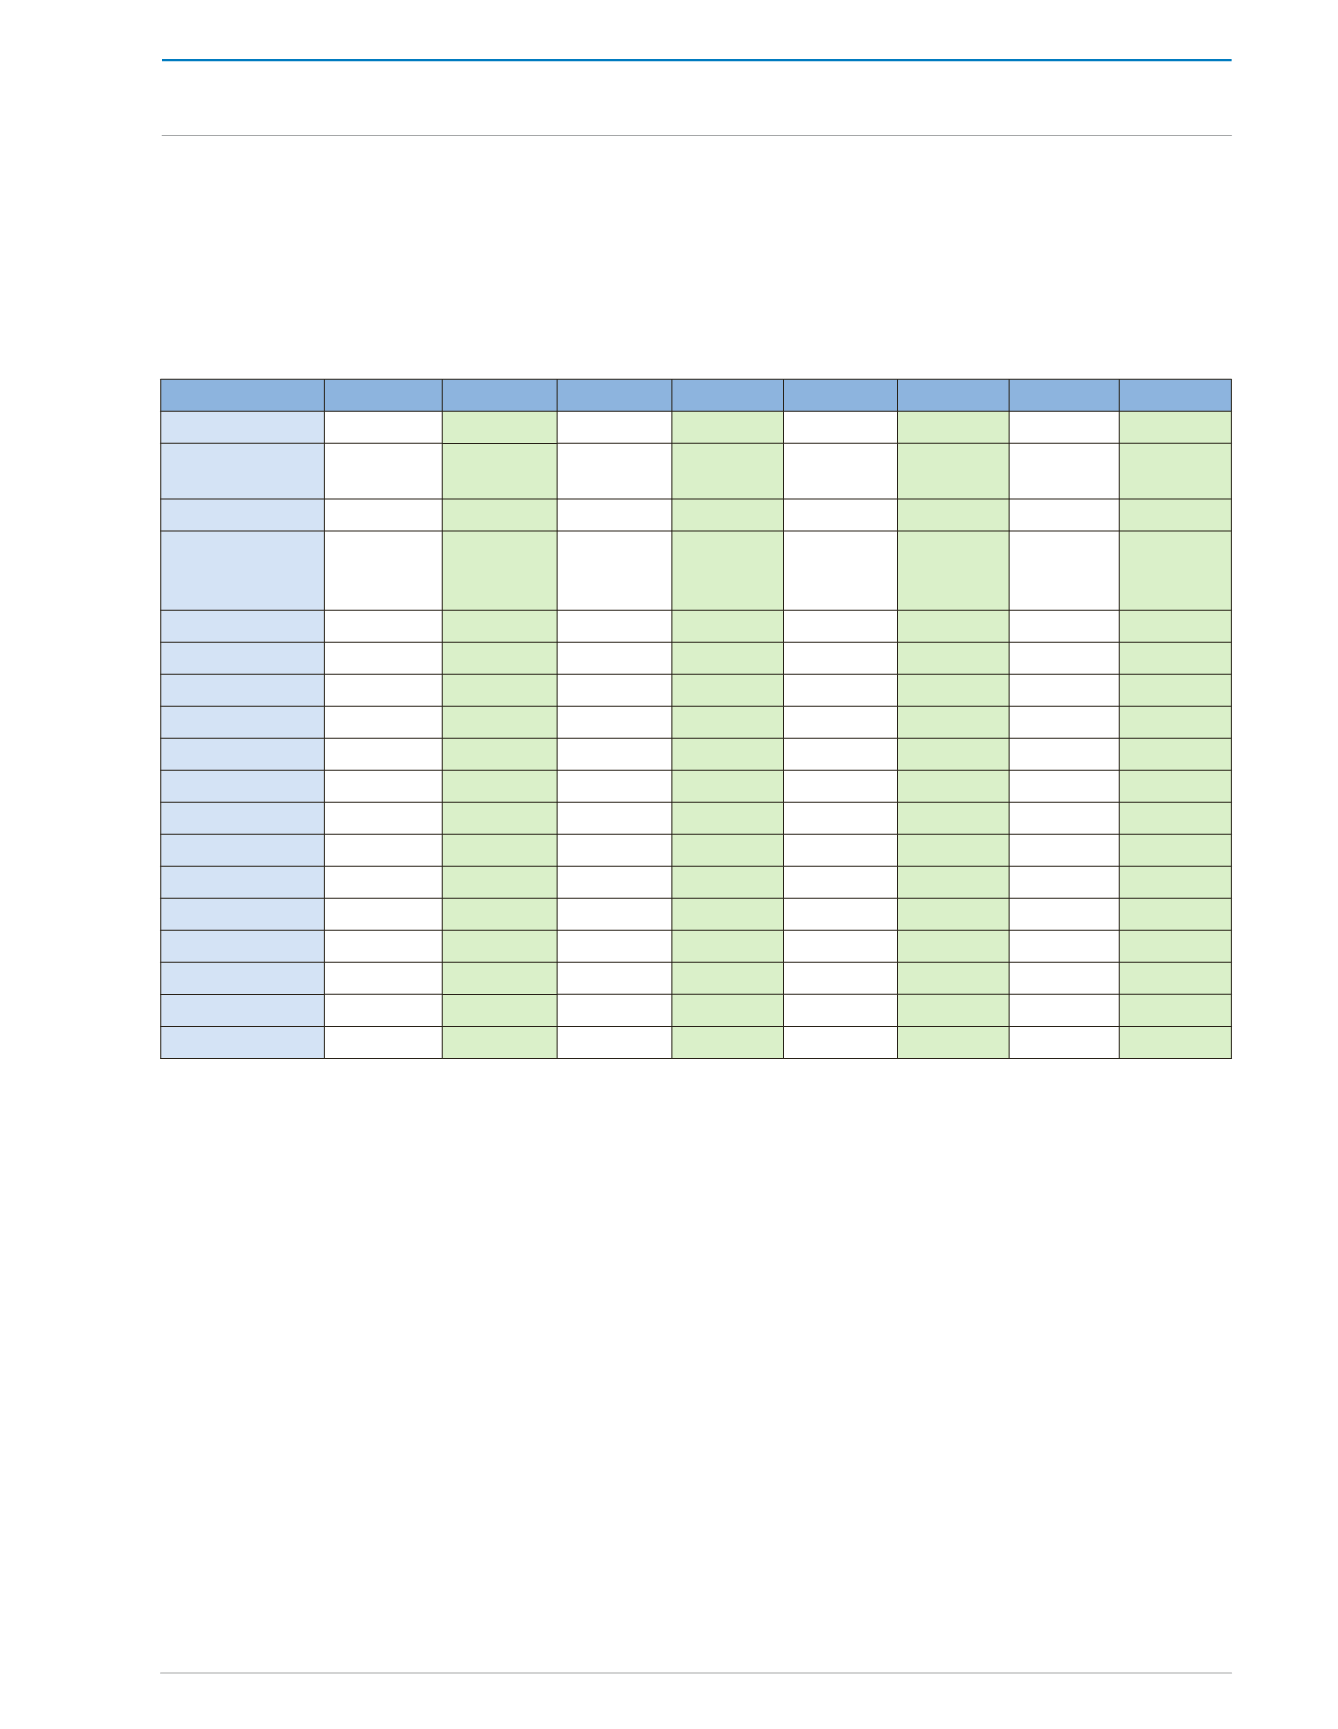
MID-YEAR ESTIMATES OF POPULATION BY AGE
2006
2007
2008
2009
2010
2011
2012
p
2013
p
Total
Population
1,297,944 1,303,188 1,308,587 1,310,106 1,317,714 1,328,019 1,335,194 1,340,557
Non-
Institutional
Population
All Ages
Under 15
328,954 330,283 331,651 332,036 333,965 273,415 274,892 275,996
15-19
142,380 142,955 143,547 143,714 144,548 98,379 98,911
99,308
20-24
115,136
115,601
116,080 116,215 116,890 114,240 114,857 115,319
25-29
99,328
99,729 100,142 100,258 100,841
123,518 124,185 124,684
30-34
94,791
95,174 95,569 95,680 96,235 105,580 106,150 106,577
35-39
105,464 105,890 106,329 106,452 107,070 92,539 93,039 93,413
40-44
92,918
93,293 93,680 93,789 94,333 86,163 86,629 86,976
45-49
76,931
77,242 77,562 77,652 78,103 96,114 96,633 97,021
50-54
64,193
64,452 64,719 64,794 65,170 87,184 87,655 88,007
55-59
47,808
48,002 48,201
48,256 48,537
73,215 73,611
73,906
60-64
38,155
38,309 38,468 38,512 38,736 58,647 58,964 59,201
65 and over
91,887
92,258 92,640 92,748 93,286 119,025 119,668 120,149
Source: Central Statistical Office
Figures for 2006 to 2010 are based on 2000 census
Figures for 2011 to 2013 are based on 2011 census
p: provisional


