REVIEW OF THE ECONOMY 2013
76
SUSTAINING GROWTH, SECURING PROSPERITY
APPENDICES
APPENDIX 14
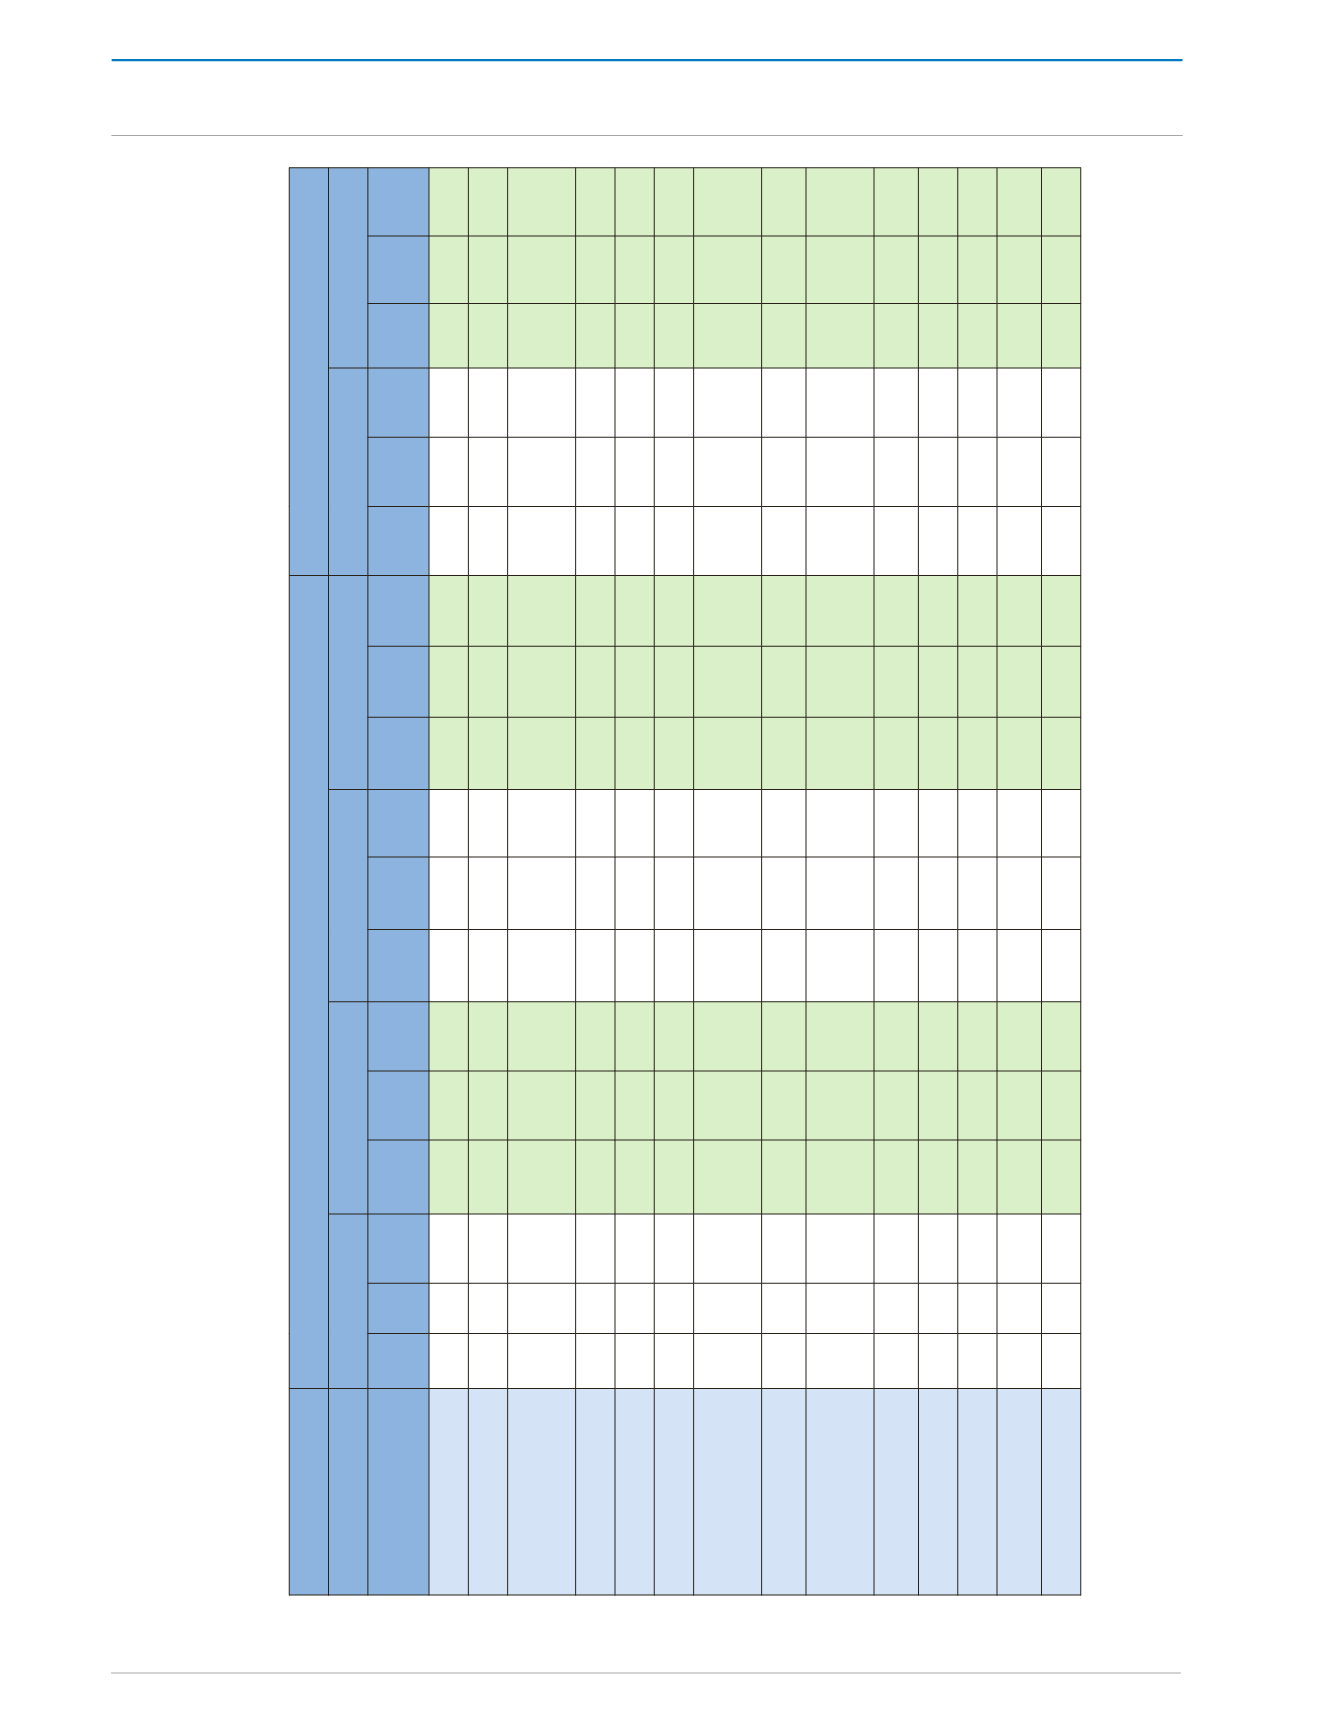
LABOUR FORCE BY INDUSTRY AND EMPLOYMENT STATUS (CSSP ESTIMATES)
/HUNDREDS (‘00)/
2011
2012
Jan - Mar*
Apr - Jun
Jul - Sep
Oct - Dec
Jan - Mar
Apr - Jun
Lab
Force
Emp
Unemp
Rate
%
Lab
Force
Emp
Unemp
Rate
%
Lab
Force
Emp
Unemp
Rate
%
Lab
Force
Emp
Unemp
Rate
%
Lab
Force
Emp
Unemp
Rate
%
Lab
Force
Emp
Unemp
Rate
%
Total Labour Force
-
-
-
6,178
5,819
5.8 6,095 5,780 5.2 6,219 5,961
4.2 6,235 5,896 5.4 6,273 5,968 4.9
Other Agriculture,
Forestry, Hunting &
Fishing
-
-
-
208 205 0.5 219 214 2.3 235 233 0.9 226 222 1.3 201
195 3.5
Sugar
-
-
-
-
-
-
-
-
-
-
-
-
-
-
-
-
-
-
Petroleum and gas
-
-
-
188 176 6.4 204 193 5.4 199 195 2.5 222 212 4.5 213 200 5.6
Construction
-
-
-
1,003
868 14.3 1,010
910 10.0 1,031
948 8.0 1,038
916 11.8 1,009
921
8.7
Wholesale/Retail
Trade, Restaurants &
Hotels
-
-
-
1,144 1,072 6.4 1,089 1,021
6.2 1,123 1,056 6.0 1,148 1,082 5.8 1,131 1,079 4.7
Transport, Storage &
Comm.
-
-
-
434 420 3.2 397 384 3.3 428 421
1.4 410 403 1.7 452 441
2.4
Finance, Insurance
Real-Estate & Bus
Services
-
-
-
548 529 2.7 602 583 3.2 562 546 2.8 566 545 3.7 536 526 1.9
Community Social &
Personal Services
-
-
-
2,084 2,001
3.8 1,967 1,887 4.1 1,995 1,928 3.4 2,051 1,957 4.6 2,126 2,025 4.8
Electricity &Water
-
-
-
64 60 4.7
74
74 0.0 72
71
2.8 79 79 0.0 89 85 4.5
Other Manufacturing
-
-
-
481
461
4.2 505 489 3.4 534 522 2.2 482 466 3.3 481 463 3.7
Other Mining &
Quarrying
-
-
-
11
10
-
12
12 0.0
11
11
0.0
7
7 0.0 9
9 0.0
Not stated
-
-
-
15
15 0.0 18
16 11.1
31
30 3.2
6
6 0.0 26 24 7.7
Source: Central Statistical Office
*No data is available for the January - March 2011 period


