REVIEW OF THE ECONOMY 2013
63
SUSTAINING GROWTH, SECURING PROSPERITY
APPENDICES
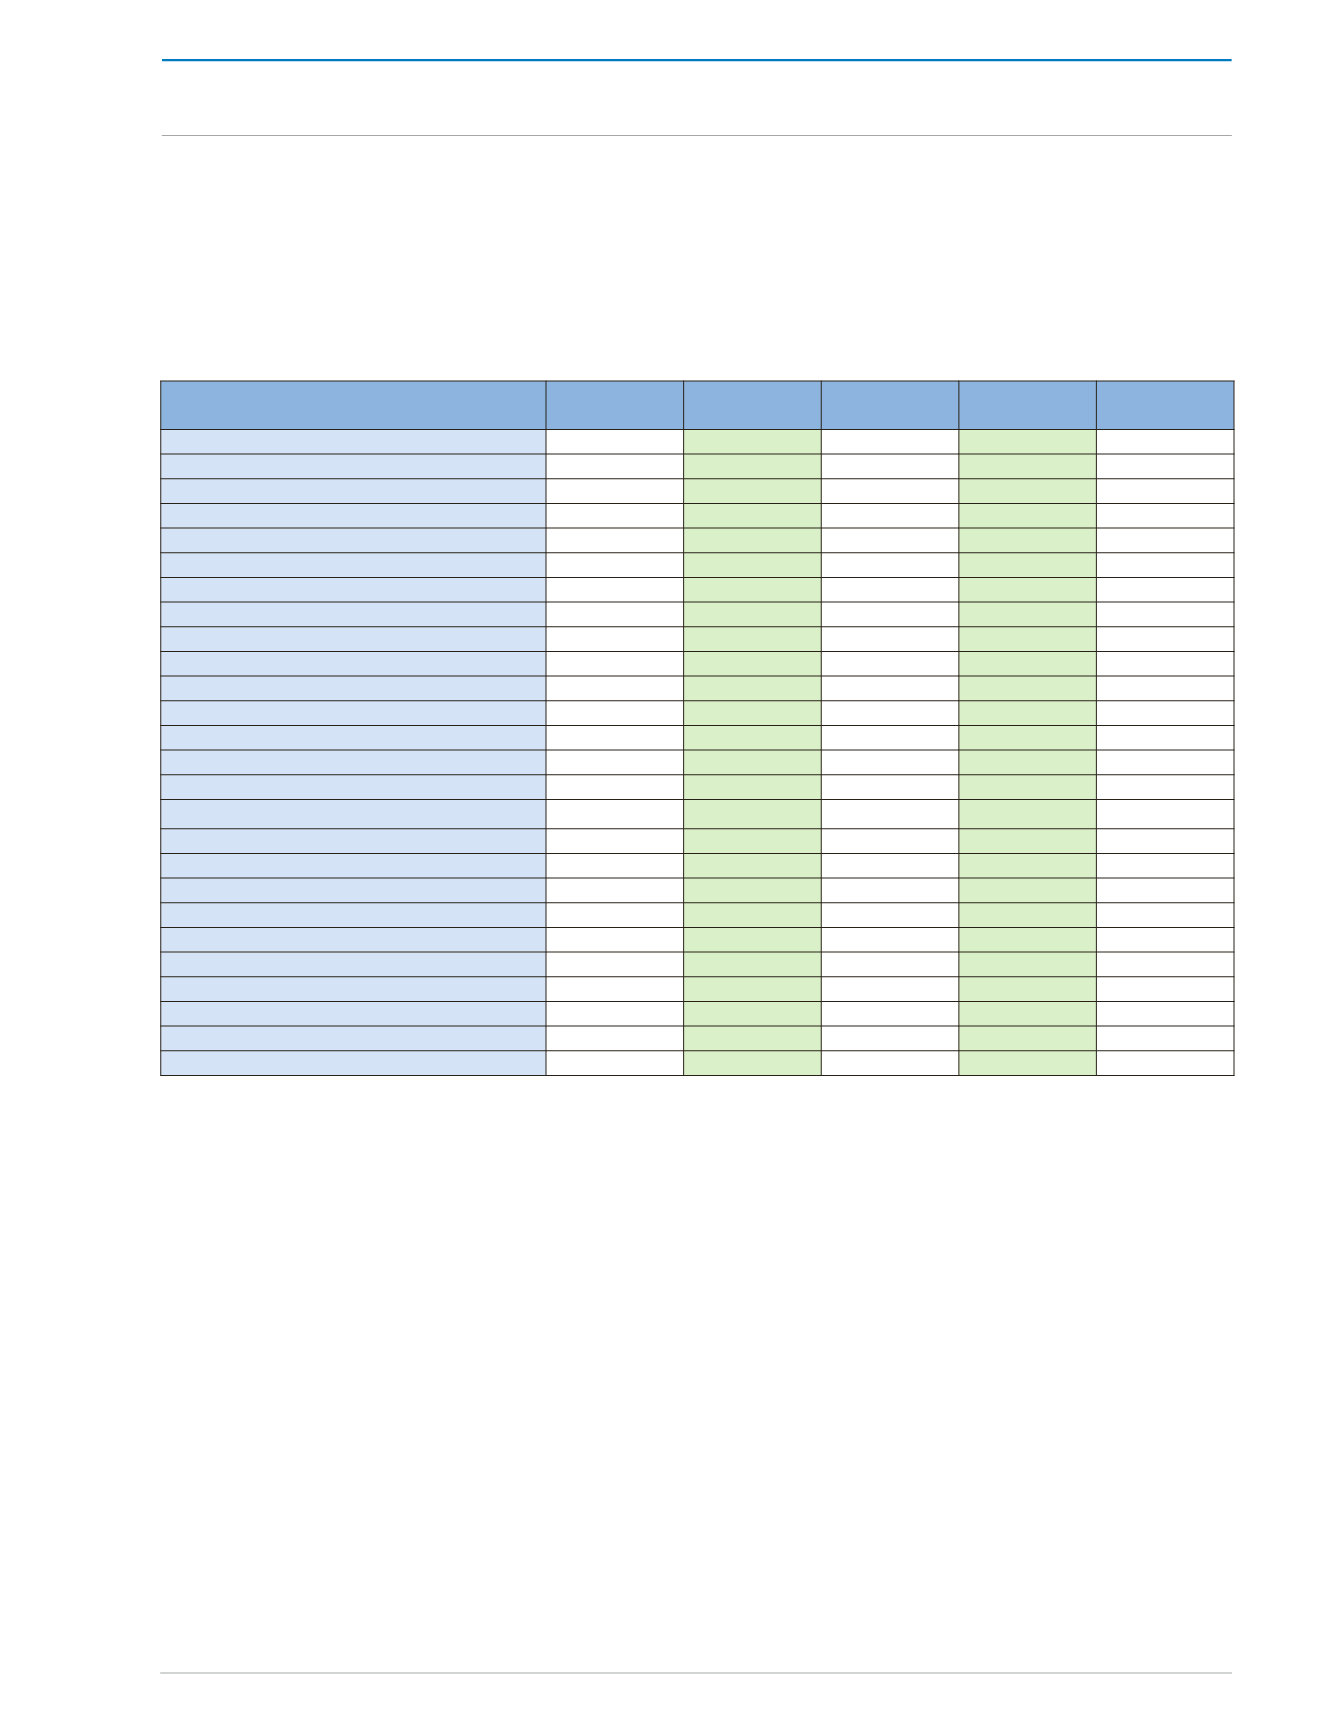
SECTOR
2009
2010
2011
2012
p
*2013
e
GROSS DOMESTIC PRODUCT
88,841.7
89,029.2
86,731.3
87,810.9
89,251.5
PETROLEUM INDUSTRY
35,944.3
37,091.2
35,644.0
35,274.5
35,437.1
NON-PETROLEUM INDUSTRY
53,068.6
51,708.0
51,469.9
52,444.7
53,754.6
Agriculture and Sugar
345.9
611.6
610.9
581.1
610.8
Manufacturing
1
7,770.0
7,861.9
7,775.5
7,746.5
8,222.6
Food, Beverages and Tobacco
3,759.9
3,901.1
3,972.9
4,031.7
4,015.9
Printing, Publishing etc.
717.9
669.5
631.7
612.4
604.1
Wood & Related Products
162.4
155.7
153.7
198.2
204.3
Chemical & Non-Metallic Minerals
1,211.5
1,245.2
1,288.8
1,286.7
1,483.1
Assembly Type and Related Industries
1,343.4
1,299.4
1,168.3
1,073.1
1,028.5
Miscellaneous Manufacturing
405.9
409.0
380.1
377.4
377.2
Services
44,952.7
43,234.5
43,083.5
44,117.1
45,268.1
Electricity andWater
1,270.6
1,271.7
1,353.3
1,413.6
1,455.9
Construction and Quarrying
6,863.2
4,913.1
4,478.8
4,389.2
4,520.9
Distribution and Restaurants
2
10,132.7
9,154.1
9,580.9
9,715.7
9,835.2
Transport, Storage & Communication
7,017.2
7,193.0
7,121.5
7,223.1
7,322.1
Finance, Insurance & Real Estate etc.
11,491.8
12,421.1
12,349.7
13,101.3
13,795.7
Government
4,965.1
5,022.8
4,989.9
5,042.1
5,098.5
FISIM
3
(3,079.3)
(2,847.7)
(2,804.8)
(2,888.9)
(2,969.7)
Add: VALUE ADDED TAX (VAT)
2,908.1
3,077.7
2,422.2
2,980.6
3,029.5
Source: Central Statistical Office (2009-2012)
*Ministry of Finance and the Economy Estimates (2013)
1/ Excludes oil refining and petrochemical industries.
2/ Excludes distribution of petroleum products.
3/ Financial Intermediation Services Indirectly Measured.
p: provisional e: estimate
APPENDIX 1
GROSS DOMESTIC PRODUCT OF TRINIDAD AND TOBAGO AT
CONSTANT (2000) PRICES
/TT$ MILLIONS/


