REVIEW OF THE ECONOMY 2013
60
SUSTAINING GROWTH, SECURING PROSPERITY
HERITAGE AND STABILISATION
FUND (HSF)
The Net Asset Value of the HSF portfolio
increased to approximately US$5.0 billion, due
to a deposit by Central Government of US$42.5
million in the third quarter of fiscal 2013.
BALANCE OF VISIBLE TRADE
For the period October 2012 to June 2013,
Trinidad and Tobago’s balance of visible trade,
declined by 4.2 percent to TT$22,185.8 million,
over the corresponding period one year earlier.
Exports declined from TT$76,977.5 million to
TT$73,707.0 million, while imports fell from
TT$53,807.3 million to TT$51,521.2 million. This
waning performance is attributable to declines
in the balance of trade excluding mineral fuels
UPA from TT$23,269.2 million to TT$22,217.8
million and in the balance of trade excluding
mineral fuels from negative TT$2,012.5 to
negative TT$4,494.3 for the period October
2011 to June 2012 and October 2012 to June
2013, respectively
(Appendix 28)
.
CARICOM TRADE
Trinidad and Tobago’s balance of trade with
CARICOM countries increased from TT$4,037.6
million for the period October 2011 to June 2012
to TT$14,155.4 million for the period October
2012 toJune2013.This increaseof 250.6percent
reflectsmainly a surge in exports of mineral fuels
from TT$2,186.7 million for the period October
2011 to June 2012 to TT$11,991.4 million for the
period October 2012 to June 2013. In addition,
imports excludingmineral fuels declined by 23.0
percent, from TT$740.5 million to TT$570.0
million. Exports excluding mineral fuels, grew
by 9.7 percent from TT$2,817.9 to TT$3,091.1
(Appendix 27)
.
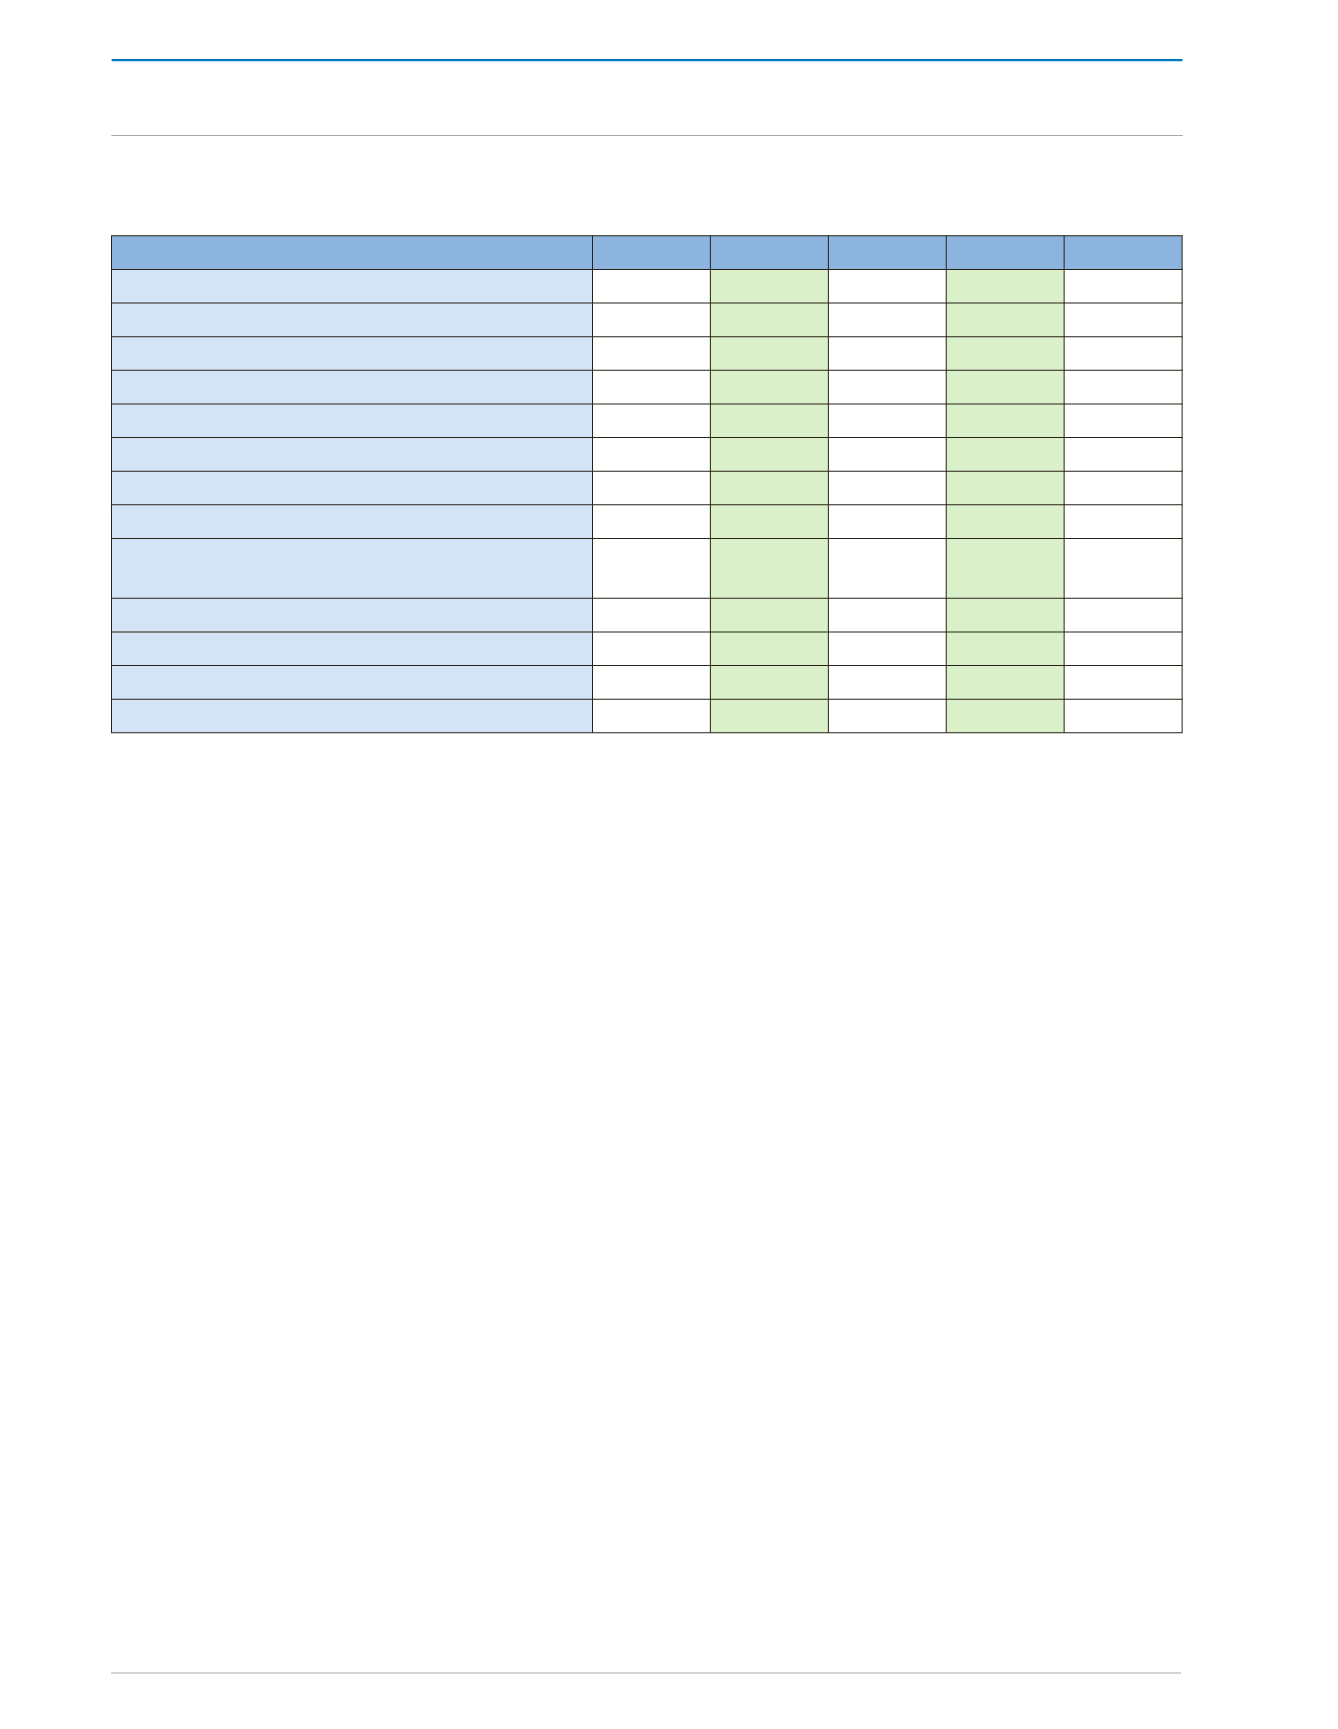
Table 10:
Summary Balance of Payments (US$ million)
2008 2009 2010 2011
r
2012
p
Current Account
8,499.0 1,632.8 4,172.3 2,898.5 959.5
Merchandise
9,070.4 2,241.2 4,735.4 5,433.0 3,918.4
Services
609.7
381.7
487.6 506.3
425.1
Income
(1,228.0) (1,017.1) (1,079.5) (3,073.9) (3,424.0)
Transfers
46.9
27.0
28.8
33.1
40.0
Capital Account
(5,793.5) (2,345.4) (3,753.9) (2,145.9) (1,581.6)
Official
114.7
(50.3)
178.8 204.8
(28.2)
State Enterprises
(10.7)
(10.7)
(10.5)
(11.2)
(11.2)
Private Sector (includes net errors and
omissions)
(5,897.5) (2,284.4) (3,922.2) (2,339.5) (1,542.2)
Overall Surplus/Deficit
2,705.5 (712.6)
418.4 752.6 (622.1)
Memo Items:
*Gross Official Reserves
9,380.3 8,651.6 9,070.0 9,822.7 9,200.7
*Import Cover
11.5
11.9
13.1
13.5
10.4
Source: Central Bank of Trinidad and Tobago
r
Revised
p
Provisional Central Bank estimates for the period March to December 2012 are based on comparative mirror trade data with the
rest of the world, and supplemental data on activity in the energy sector
*
Includes Errors and Omissions
TRADE AND PAYMENTS


