25
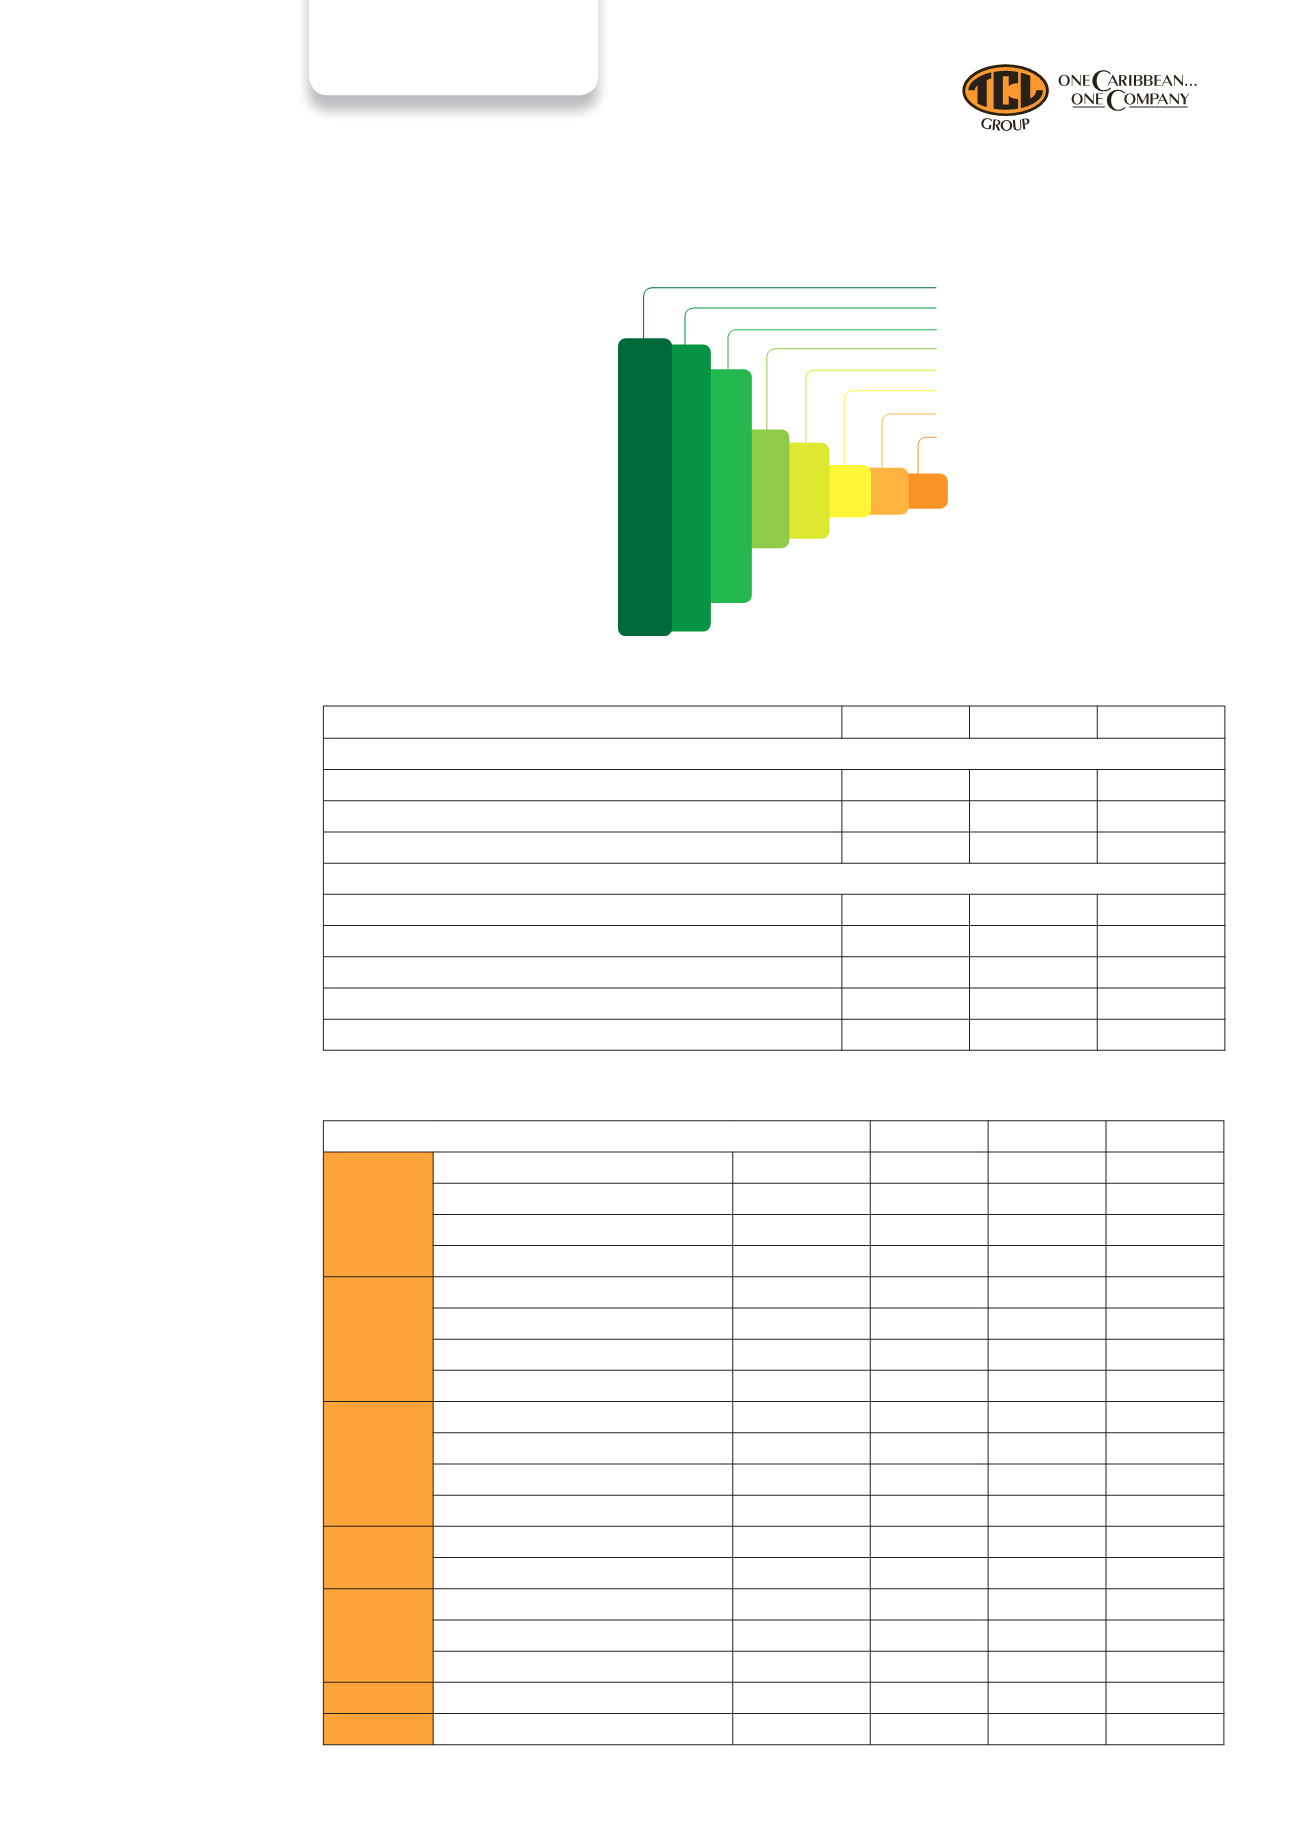
Distribution of Shareholding
Individuals
25.51%
Banks/Pension Funds
24.58%
Sierra Trading
20.00%
NIB
10.16%
Baleno Holding
8.21%
Unit Trust
4.49%
Other Foreign Investors
4.03%
Insurance Companies
3.02%
2012
2011 % Change
TCL
Clinker production
‘000 tonnes
494.2
656.4
-24.7%
Cement sales - Local
“
511.6
535.2
-4.4%
Cement sales - Export (3rd party)
“
180.1
292.2
-38.4%
Cement sales - Total
“
691.7
827.4
-16.4%
CCCL
Clinker production
‘000 tonnes
652.6
628.3
3.9%
Cement sales - Local
“
536.3
553.1
-3.0%
Cement sales - Export (3rd party)
“
203.8
216.8
-6.0%
Cement sales - Total
“
740.1
769.9
-3.9%
ACCL
Clinker production
‘000 tonnes
159.7
184.1
-13.2%
Cement sales - Local
“
98.4
110.4
-10.9%
Cement sales - Export (3rd party)
“
69.6
112.2
-37.9%
Cement sales - Total
“
168.0
222.6
-24.5%
TPL
Paper sack production
millions
19.4
31.8
-38.9%
Paper sack sales
“
26.8
32.8
-18.2%
TPM
Sling production
thousands
308.2
393.5
-21.7%
Sling sales
“
325.7
375.4
-13.2%
Jumbo bag sales
“
16.3
33.5
-51.3%
RML Group
Concrete sales – T&T, Barbados
‘000m
3
111.2
108.6
2.4%
JGQ
Gypsum sales
‘000 tonnes
64.8
79.5
-18.5%
2012
2011 % Change
Income Statement
Group Third Party Revenue $m
1,615.90 1,560.86
3.5%
Group (Loss)/Profit attributable to Shareholders $m
(319.95)
(325.32)
1.7%
Foreign exchange earnings $m
279.6
271.9
2.8%
Balance Sheet
Total Assets $m
3,787.81
3,953.05
-4.2%
Shareholders’ Equity $m
807.16
1,125.70
-28.3%
Net Assets per Share $
3.14
4.68
-32.9%
Total Long Term Debt $m
2,046.12
1,678.40
21.9%
Total Long Term Debt to Equity Ratio %
260.75
143.68
81.5%
Operational Highlights
Group Performance Highlights
The Year in Review


